BME100 f2016:Group8 W1030AM L3
| Home People Lab Write-Up 1 | Lab Write-Up 2 | Lab Write-Up 3 Lab Write-Up 4 | Lab Write-Up 5 | Lab Write-Up 6 Course Logistics For Instructors Photos Wiki Editing Help | |||||||
|
OUR TEAM
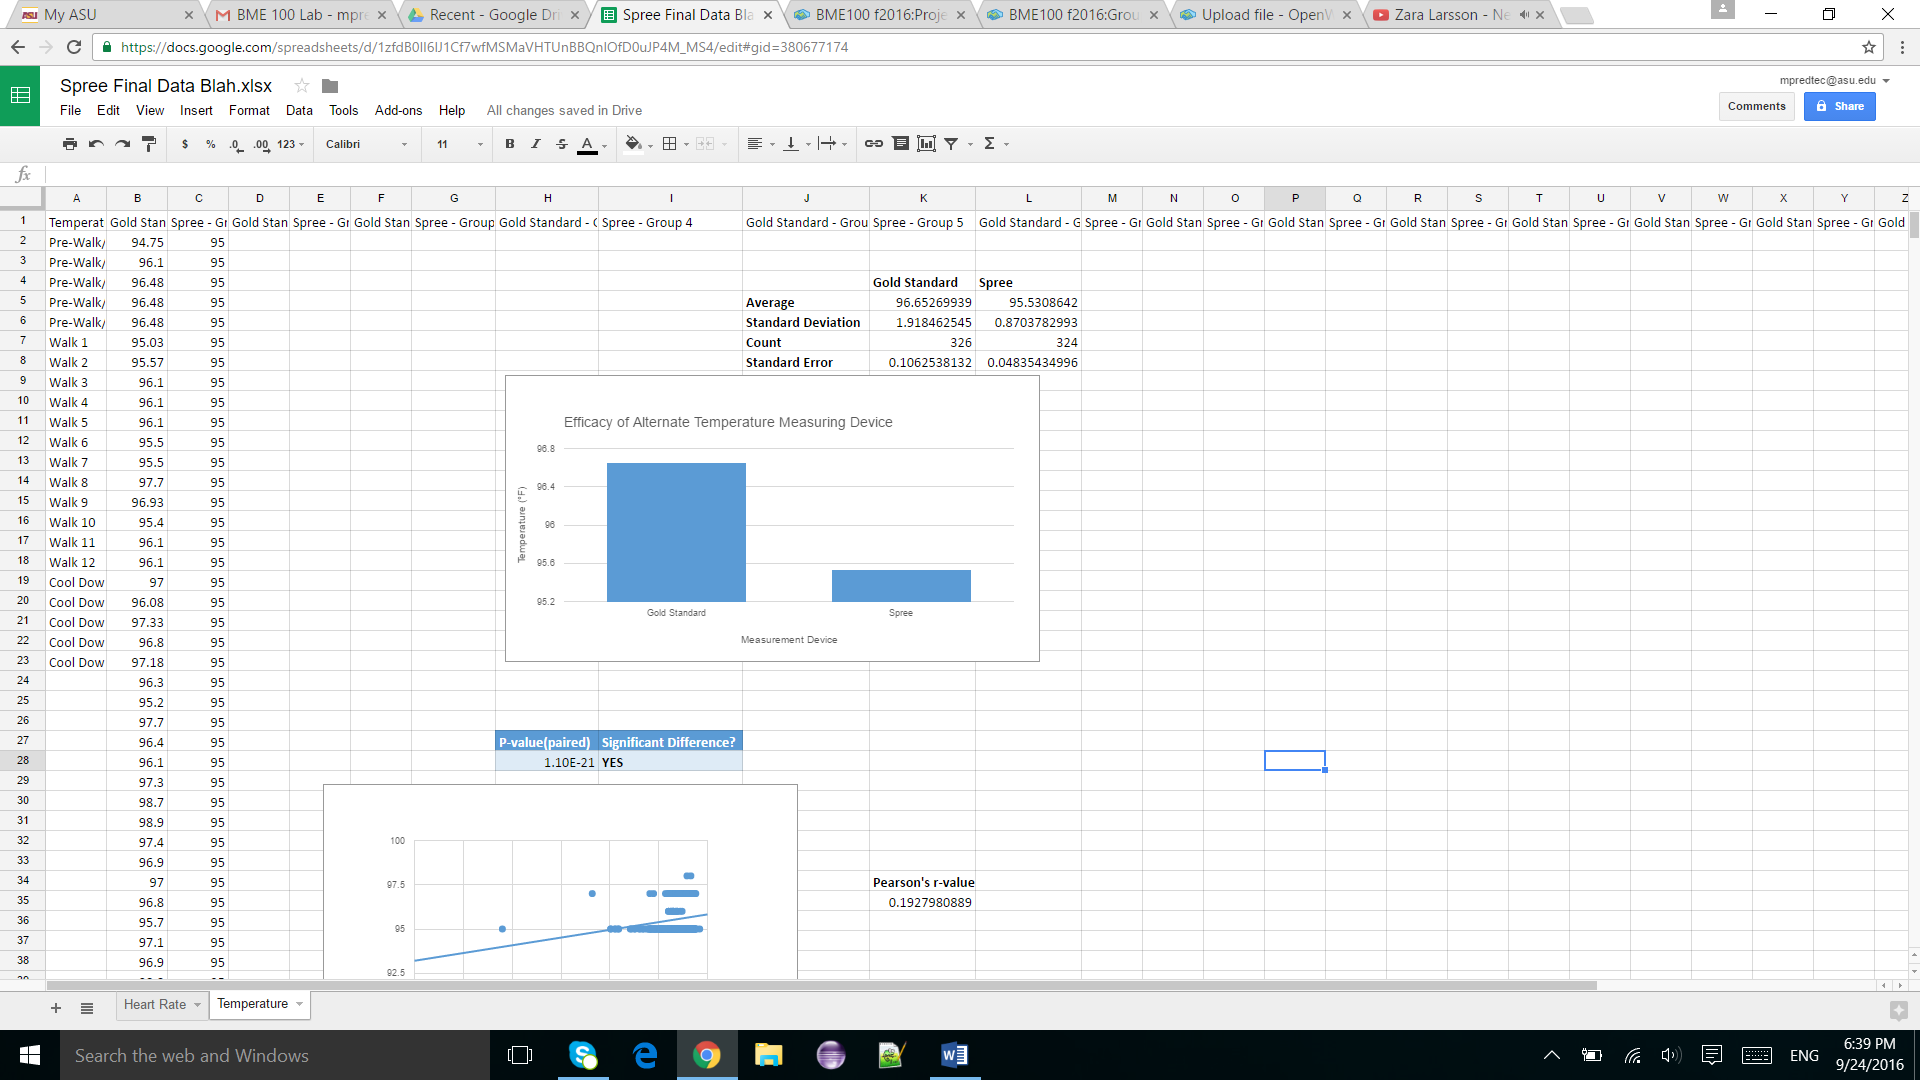
LAB 3 WRITE-UPDescriptive Stats and GraphTemperature: Mean (Gold,Spree) = 96.58268519, 95.5308642 Standard Deviation(Gold,Spree)= 1.891371215, 0.869034085
Inferential StatsTemperature: Correlation (R)= 0.216502909 R(squared)=0.465299
Design Flaws and RecommendationsGold vs. Spree (Temperature): Since our P-value of 1.809 x 10^-20 is so low (<0.05), we can conclude that our test was statistically significant and there is no correlation between temperature readings of the Gold device and the readings of the Spree device. This means the Spree device is not nearly as accurate as the standard Gold device and should not be used to measure temperature. We recommend that the Spree device be modified so that it has more accurate readings on temperature or to not be used at all in a clinical setting.
Since our P-value of 0.662506 is so high (>0.05) we can conclude that our test was not statistically significant and there is a correlation between the heart rate readings of the Gold device and the readings of the Spree device. This means the Spree device was very close in terms of accuracy to the standard gold device and is an accurate way of measuring heart rate. We recommend that the Spree device can be used in a clinical setting or elsewhere.
Experimental Design of Own DeviceThe unique set of catheter fittings will be shipped to specific hospitals and tested over a period of many months. These will be tested against the control group of the standard Luer fittings that are currently widely used in hospitals. 10 hospitals will be the control group and 10 will be under specific protocol to use the new connectors provided. These hospitals will be of similar size and number of staff. They will both record instances of catheter misconnections and errors to provide data that can be compared. This data will be gathered for a period of six months and compared using statistical analysis to verify the effectiveness of custom fittings in preventing misconnections and patient injury
| |||||||


