BME100 f2016:Group7 W1030AM L6
| Home People Lab Write-Up 1 | Lab Write-Up 2 | Lab Write-Up 3 Lab Write-Up 4 | Lab Write-Up 5 | Lab Write-Up 6 Course Logistics For Instructors Photos Wiki Editing Help | ||||||
|
OUR COMPANY
LAB 6 WRITE-UPBayesian StatisticsOverview of the Original Diagnosis System The diagnosis system employed by our class consisted of fifteen teams, of five students each, running diagnostics on thirty patients. In order to reduce the occurrence of error, three samples from each individual patient were used in the PCR diagnostic tests. These samples were also compared to two control samples, one proven to contain the disease SNP and the other lacking the SNP. ImageJ, the software used to detect the fluorescent presence of SYBR Green in the samples, had procedural controls to reduce error by including samples with unadulterated water and overabundance of SYBR Green. Additionally, three images were captured of each sample for use in ImageJ's analysis software to achieve more accurate results. The results of the class's diagnostic tests included positive, negative, and inconclusive conclusions. A total of seventy-eight PCRs were taken, twenty-three returned a positive result and forty-seven returned negative results. This left eight results, four of which were inconclusive and the other four blank. Of the thirty patients, seven received a positive diagnosis, sixteen a negative diagnosis, three found inconclusive, and four left blank. As this was the first time using ImageJ software, mistakes in its proper use resulted in inaccurate and unusable results. What Bayes Statistics Imply about This Diagnostic Approach
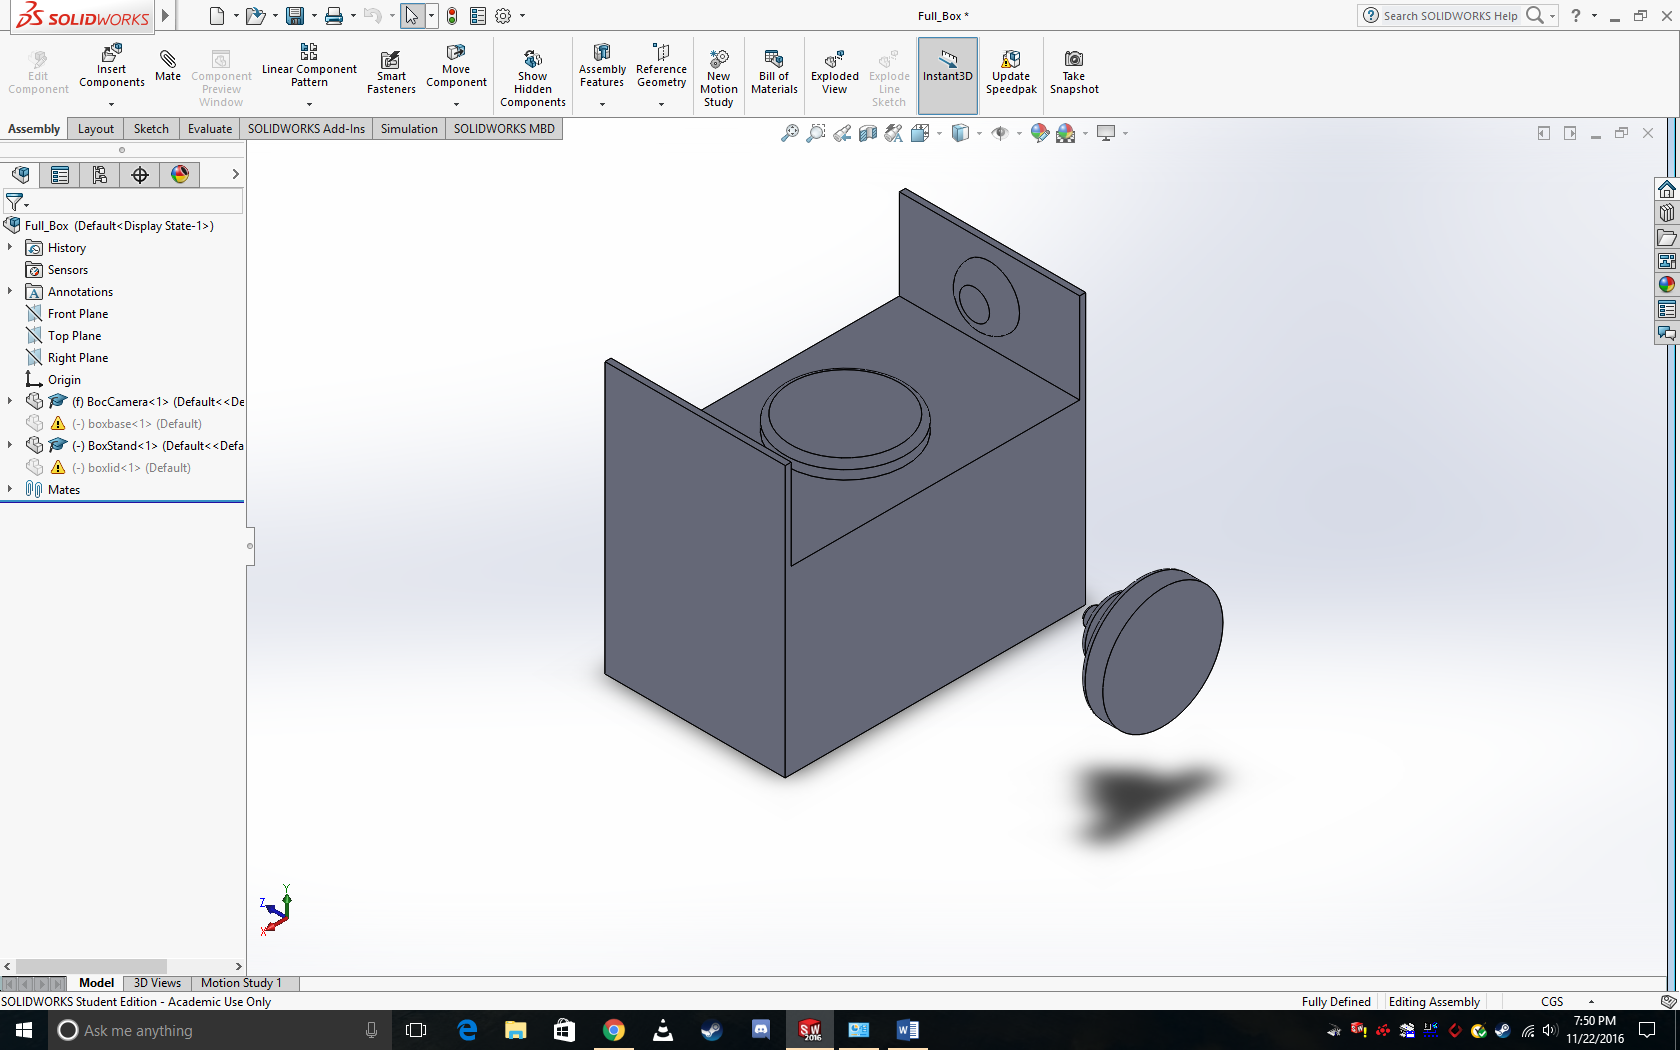
Intro to Computer-Aided Design3D Modeling The software we used was a computer aided drafting system called solidworks. Solidworks has a very steep learning curve and is quite a challenge to just start off with. Each of our group members found it to be a bit overwhelming at first, however after becoming a bit more comfortable we did notice that it does start to become fun to use. Though one of the biggest hurdles that we need to overcome is figuring out how to properly model curves so that all of our parts don't come out so box-y. We also felt that there wasn't really enough time to develop the proper competence with the software prior to completing our redesign, nonetheless it was interesting. Our Design NOTE: For some reason our box design isn't loading properly, so will have to adjust this image if possible, however just know that it is supposed to be in an enclosed box with a lid with a round opening on the top.
Feature 1: ConsumablesIn our kit we would have to include several of the reagents; the SYBR Green, primer, and PCR mix solutions. We would also need to include a set (about 60) of glass slides, and some kind of data storage device e.g.: a micro SD card. Our device would require that the user have a micropipette however, we would want to keep costs down so we probably wouldn't want to include that with our unit this would also mean that anything else that is related to the micropipette would also not be included e.g: tips a waste bin for the tips, et cetera. Feature 2: Hardware - PCR Machine & FluorimeterThe open PCR machine will be included as is. AS a group we decided that there simply wasn't too much that was inefficient about it at the time to necessitate redesigning it. As such we would have to include the price of licensing the machine in to account. This also means that we would have to include information on how to use the open PCR machine and any necessary programs required to run the device. As for the fluorimeter, we would include it but in a modified fashion.
The modifications we would be making to the device would essentially package the Fluorimeter into a "dark-box" equipped with an attached camera so that no clumsy set up is required by the user. Our thought here was that firstly, the picture quality was fairly poor as most cell phone cameras don't usually operate in such dark environments. Also, while it was kinda of "fun" setting up the system, it also invites more and more room for error which can hurt your results. So by packaging all of the important components of the system together we reduce the opportunity for error and decrease the need for user expertise, as all the user would have to do is insert their sample into the the system from the top of the box.
| ||||||


