BME100 f2016:Group6 W8AM L6
| Home People Lab Write-Up 1 | Lab Write-Up 2 | Lab Write-Up 3 Lab Write-Up 4 | Lab Write-Up 5 | Lab Write-Up 6 Course Logistics For Instructors Photos Wiki Editing Help | ||||||
|
OUR COMPANY
Touch PCR
LAB 6 WRITE-UPBayesian StatisticsOverview of the Original Diagnosis System For this PCR lab, sixteen groups of roughly five students tested and diagnosed two patients per group, for a total of thirty two patients. Using Open PCR and flourimeter techniques, each patient's DNA was tested for the disease-associated SNP and analyzed using ImageJ software. Each patient's DNA was replicated three times, with three pictures per replication, in order to minimize errors in the readings and analysis techniques. Once the pictures of the DNA samples were taken and analyzed, the data collected was compared to the positive and negative control readings, which were each tested and analyzed three times in order to improve the likelihood of a correct diagnose for the patient. Furthermore, to minimize error, the ImageJ calibration controls were set to remove any readings from the background that could interfere with the readings of the DNA droplet. Once the ImageJ readings for each of the forty two pictures was analyzed, the results were averaged. By taking, analyzing and averaging results from three pictures for each replicate of a patient's DNA, the accuracy of the readings improved and the risk of error was decreased in case one picture was blurry or provided skewed data. As a result of the precautions taken to prevent error, the final data collected largely resembled the diagnosis concluded by the doctor. Although the majority of the PCR based diagnoses agreed with the diagnoses of the doctor, there were some inconsistencies which could have resulted from human error. The majority of the human error occurred during the flourimeter analysis. Due to difficulties focusing the camera and the issue light entering the black box, the green light was sometimes hard to detect in the pictures and, therefore, led to inaccuracies in the analysis. Furthermore, the challenges endured by some groups when using the flourimeter resulted in blank data, ultimately leading to the diagnosis of only thirty patients. In addition to difficulties with the flourimeter, inaccurate ImageJ readings, due to human error with respect to the circles drawn around the PCR droplets, provided another source or error, decreasing the overall accuracy of the diagnoses.
Intro to Computer-Aided Design3D Modeling Our Design
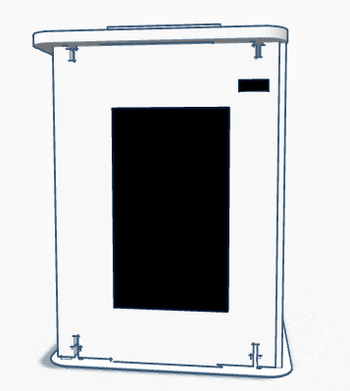
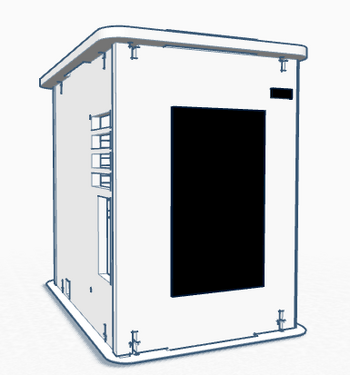
Feature 1: ConsumablesOur group decided not to change any of the consumables.The very important consumables are the ones needed for the open PCR program: the PCR mix, primer solution, and SYBR Green solution. All of these consumables will be used to run our PCR program. The reason we decided not to change any of the consumables is that the PCR machine in our system has minimal changes to the operation and process used to analyze the DNA. The machine is consolidated for greater ease of use by putting the software and an operable touchscreen directly on its front surface. This change makes the system more user friendly without creating a need to redesign the basic consumables, making it compatible with current designs and techniques. Feature 2: Hardware - PCR Machine & FluorimeterIn the lab, the PCR machine was set up initially using a computer program. It then ran a set number of cycles at temperatures input through the program. For information about how the software was programmed for this PCR reaction, click here. This led to problems when the computer used for the machine would automatically turn off. The program would sometimes be interrupted or deleted upon the computer's shut down. To eliminate this issue, the lab group included a touch screen interactive surface on the front-facing panel of the PCR machine. In order to retrieve the data, software would be included with the touch screen that would allow data to be safely transferred onto a USB drive or other device. This Open PCR machine will operate identically to the prior version, however the software and hardware to set up and run cycles will be included and be operated directly from the device. It would operate with a limited number of commands and available processes, but would include those necessary for its function as a PCR machine. This element of the PCR machine redesign eliminates the need for a computer during an extensive process. In essence, this machine allows for a more one and done type of operation. It could be quickly and easily set up, left alone overnight to perform the cycles, and data can be retrieved afterward with little to no hassle. The elimination of computer connection allows for the machine to be a much more independent process. The fluorimeter will still be used identically to how it is traditionally used with polymerase chain reactions. The flaws with the fluorimeter are minimal and would require extensive redesign only to fix a small problem. The fluorimeter is used by dispensing substances onto a slide. A light is shown through the substance and a camera and imaging software is then used to analyze how the light passes through the substance, which can give clues to what the results are. For more information on how the fluorimeter is used in this polymerase chain reaction system, click here.
|
||||||


