BME100 f2016:Group6 W1030AM L5
| Home People Lab Write-Up 1 | Lab Write-Up 2 | Lab Write-Up 3 Lab Write-Up 4 | Lab Write-Up 5 | Lab Write-Up 6 Course Logistics For Instructors Photos Wiki Editing Help | |||||||||||||||||||||||||||||||||||||||||||||||||||||||||||||||||||||||||||||||||||||||||||||||||||||||||||
Biomarvel Engineroes
LAB 5 WRITE-UPPCR Reaction ReportTo set up the reaction, one member of the group pipetted 80μL of a sample onto a slide. Immediately after, 80μL of SYBR Green 1 was added into the sample on the slide. This was added in order to detect the amount of DNA in the sample. This process was repeated for each sample, using a new tip with each test and with the SYBR Green 1 being exposed to as little light as possible before the images were taken. The pre-lab reading was helpful in the sense that it explained to us how the PCR reaction worked and how important it would be for our results to be accurate and careful in the pipetting process. The difference between the first and second stop on the pipettor was understood. The samples and SYBR Green 1 were sucked into the pipette until the first stop was reached, and were expelled from the pipette onto the slide by pressing down to the second stop. The second stop includes a small puff of air in order to rid all solution from the tip of the pipette, increasing accuracy of the volume of solutions. All final reactions contained the same amount of liquid. This is was ensured by pipetting the same amount into the PCR reactions. No, there was no liquid left in the tubes after the testing. All samples were used. No, the labeling scheme did not have to be altered. Fluorimeter ProcedureImaging set-up First, we calibrated our cell phone camera (HTC 10) by A. INACTIVATE THE FLASH
B. SET ISO TO 800
C. SET WHITE BALANCE TO AUTO
D. SET EXPOSURE TO HIGHEST SETTING
E. SET SATURATION TO THE HIGHEST SETTING
F. SET CONTRAST TO LOWEST SETTING
Next, we placed the fluorimeter on top of a few containers to raise the scanning surface to be nearly level with the camera's lens (~12-13cm). Then the HTC 10 was placed vertically in a cradle about 4 cm away from the fluorimeter. A hydrophobic glass slide was placed in the fluorimeter so that the beam of light was between the first two rows of dots, and the camera was centered on the slide so that the field of vision encompasses the entire slide surface. Finally, we placed a lightbox over the entire apparatus with one side flap open, but free to close. Placing Samples onto the Fluorimeter
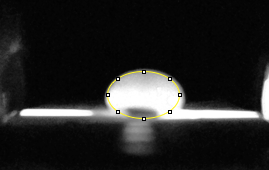
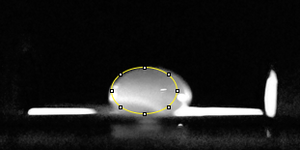
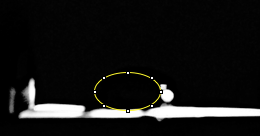
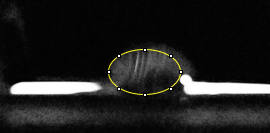
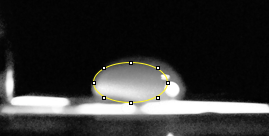
Data Collection and AnalysisImages of High, Low, and Zero Calf Thymus DNA
Images of Our PCR Negative and Positive Controls
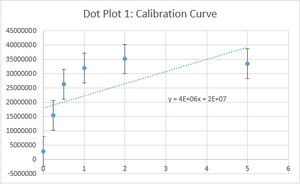
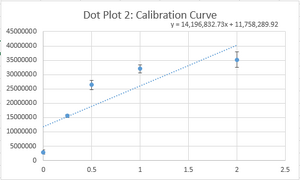
PCR Results: PCR concentrations solved
PCR Results: Summary
| |||||||||||||||||||||||||||||||||||||||||||||||||||||||||||||||||||||||||||||||||||||||||||||||||||||||||||


