BME100 f2016:Group5 W1030AM L6
| Home People Lab Write-Up 1 | Lab Write-Up 2 | Lab Write-Up 3 Lab Write-Up 4 | Lab Write-Up 5 | Lab Write-Up 6 Course Logistics For Instructors Photos Wiki Editing Help | |
|
PCR 25 LAB 6 WRITE-UPBayesian StatisticsOverview of the Original Diagnosis System In BME 100, 17 teams of 6 or 5 students tested two patients each using image j and open PCR reactions. Every group did three tests on both of their subjects as well as a positive control and a negative control. The reason why 3 were done each was to ensure the accuracy of the results. From these samples, we used a fluorimeter as well as a dye named SYBR green and took images of all of the dots placed in the fluorimeter. These images were then uploaded to image J and this program allowed for the color of the dot to be determined as well as the area and diameter of the dot. What this did was allow for the students to determine the amount of DNA in each drop of the sample. One way that we prevented error was by taking three images per drop of each test, this ensures that the data should be consistent after doing the image J on all three images. Some problems that we encountered with our images and the image J software was that our phone stand on the fluorimeter kept moving so the distance of all the images was different. This caused the image J numbers to be false or impossible for many of the drops, so this error did in fact tamper with our data.
According to the results for calculation 1, it would imply that there is about 80% probability that the patient will be given a positive final test conclusion. The results for calculation 2 infer that there is about 98% probability that the patient will be given a negative diagnostic signal. There is roughly around 40% chance that the patient will develop the disease, given the positive final test conclusion and about 97% chance that the patient will not develop the disease, given a negative final test conclusion. This prediction was gathered through the results for calculations 3 and 4. During the PCR and detection steps, there could have been a few factors that affected the overall data. First, there could have been bubbles when pipetting the calf DNA which influenced the amount of calf DNA. Second, the pictures were not taken at the same angle which could have influenced the mean and area values. Lastly, the amount of light in the box that entered could have varied slightly and altered the pictures. All of these possible sources of either human or machine/device error could have influenced the Bayes values in a negative way.
Intro to Computer-Aided Design3D Modeling Our Design
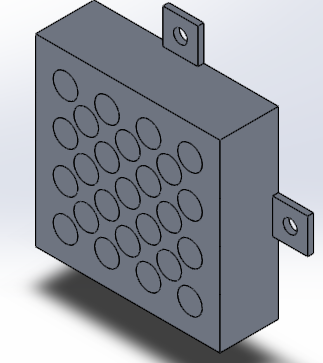
Our design was to change the main heating block to create more wells for more PCR tubes. What we did was increase the number of wells from 16 to 25 to allow for more PCR reactions to occur at once. The reason why we did this is because it would be more convenient to be able to do multiple PCR reactions at once. It would allow for many more controls to be tested with a sample, and this would allow for much more accurate results.
Feature 1: ConsumablesIn the new PCR design, all of the consumables from the old PCR device were kept which includes plastic tubes, glass slides, pipettes. This includes non-machine items like primer solution, buffer, SYBR Green solution, and PCR mix. The way consumables will be packaged into in the new kit will be in correlation with when it is used in the PCR reaction process. Each step of the PCR process will have individual boxes that have the consumables that will be used in that specific step. After the step, those items would be disposed and the user would move on to the next step, repeating the process. Because of that, it ensures that there are no missing pieces and the users are able to understand which consumables to use during a specific process.
Feature 2: Hardware - PCR Machine & Fluorimeter[insert here oh great lab partners: Summarize how you will include the Open PCR machine and the fluorimeter in your system. If either or both of these is being excluded, explain why and how your design will utilize a new type of hardware. You may add a schematic image. An image is OPTIONAL and will not get bonus points, but it will make your report look really awesome and easy to score]
| |


