BME100 f2016:Group3 W1030AM L6
| Home People Lab Write-Up 1 | Lab Write-Up 2 | Lab Write-Up 3 Lab Write-Up 4 | Lab Write-Up 5 | Lab Write-Up 6 Course Logistics For Instructors Photos Wiki Editing Help | ||||||
|
OUR COMPANY
PCR for the People LAB 6 WRITE-UPBayesian StatisticsOverview of the Original Diagnosis System The labor for the PCR Lab was split between 15 teams of 6 students. Each team had 2 “patients” that they had to diagnose, there were a total of 30 patients for the whole BME lab. However, two groups did not share their results. In order to prevent error, each patient had 2 additional replicates of their DNA that were also tested for the diseased SNP; a total of 3 PCR reactions were run for each patient’s DNA. Running duplicates of patient’s DNA increased the sample size which, in turn increased the reliability of the results. The negative and positive PCR controls provided values that aided in determining whether the patient was positive or negative for the diseased SNP. ImageJ software was used to measure the amount of fluorescence - indicating the amount of DNA - in each of the samples. To ensure ImageJ could accurately measure the amount of DNA, the fluorimeter was calibrated using known concentrations of DNA. After calibration, three images were taken for each drop; the increased sample size also increased the reliability of the results. After compiling the data from all the groups that submitted their PCR results, the frequency total for the positive conclusions was a 27%, compared to the “yes” diagnosis which was also at 27%. However, the frequency total for negative conclusions was a 62%, compared to the “no” diagnosis frequency of 73%. The total frequency for the total positive conclusions of PCR with a “yes” diagnosis was 43%. The total frequency for the total negative conclusions of PCR with a “no” diagnosis was 81%.
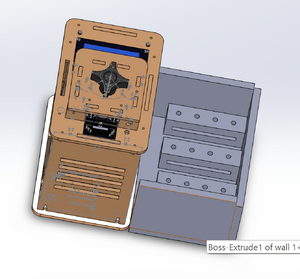
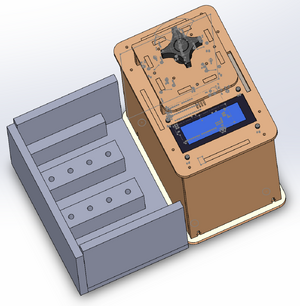
Calculations 1 and 2 measured the probability that a patients final test conclusion would coincide with the diagnostic signal. These calculations answered the question: do the PCR conclusions coincide with the correct PCR reactions? Calculation 1 measured the likelihood that a positive conclusion will be drawn from a positive PCR reaction. Calculation 1 also measured how reliable the individual PCR replicates were. If a high percentage of the PRC replicates came to the same conclusion as the reaction (positive conclusions drawn from positive PCR reactions or negative conclusions drawn from negative PCR reactions), then the individual PCR replicates are considered to be reliable. Calculation 1 concluded that the probability that a person with the disease SNP tested positive was close to .8 or (80%). This probability value implies that the a majority of the individual PCR replicates are reliable (because it was close to 1.00 or 100%). Calculation 2 measured the likelihood that a negative conclusion will be drawn from the presence of the a negative PCR reaction. This value was close to 1.00 (100%), meaning that there is a high probability that the a negative test conclusion was assigned to a PCR sample with a negative PCR reaction. The frequency of the PCR conclusions compared to the doctor diagnoses were measured in calculations 3 and 4. Calculation 3 measured the probability that a positive doctor diagnosis (the gold standard) coincided with a positive PCR conclusion. The probability was close to .4 (40%), meaning that a majority of the time, a positive doctor diagnosis did not coincide with a positive PCR result. PCR was not reliable in detecting the disease. Calculation 4 measured the probability that a patient not will develop the disease, given a negative final test conclusion. If a high percentage of the negative PCR results came to the same conclusion as the doctor diagnosis, then the results are considered to be reliable. Calculation 3 concluded that the probability that a person without the disease SNP tested negative was close to 1.0 or (100%).This value was close to 1.00 (100%), meaning that the reliability of the PCR results for diagnosing a patient as negative is nearly perfect. One possible source of human error during the trails was not having a consistent and accurate distance from camera to droplet. This error could have caused our ImageJ analysis to send back unreliable numbers for multiple investigations. Another source of human error during the trails was not having accurate concentrations per tube. While the instructions were clear with how much of each solution should be placed into the individual tube, the micropipettes were difficult to use and caused some of the solution inside to not be put completely in the tube. A final source of human error was the fact that after each trial, in order for a new drop to be placed on a slide, the entire contraption had to be disassembled. This building and tearing down and rebuilding was not done the exact same each time, and could have caused slight variations that resulted in bad statistics. Intro to Computer-Aided Design3D Modeling Our team used SolidWorks in order to create a model of our product. We took the original OpenPCR machine and added on a flourimeter to it. It was relatively easy to find a model of the OpenPCR machine from their website and get it into a SolidWorks file that we could use. From there we created the part of the flourimeter that we needed. This then allowed us to create a full assembly of the OpenPCR machine with our flourimeter attached. We added an open box like structure on to the side of the machine. Inside this box you can see that there are 3 compartments that hold 4 PCR tubes each. There are LED lights that are on the backs of all the compartments that will shine into the slits on the front of the compartments in behind it. This light will then shine on to a mirror that is at a 45 degree angle and into the PCR tube. The PCR tubes will then reflect light back down into the bottom of the compartment to be read and analyzed.
  Our group struggled with using the fluorimeter. More specifically, setting up the fluorimeter/lightbox apparatus was a challenge. The cradle that held our phone did not keep it steady; some of the pictures turned out blurry so multiple pictures had to be taken of a single drop, which was time consuming. Also, in order to remove the drop or place a new drop on the slide, the lightbox had to be dissembled. Also, using Image J to analyze the samples took some time to get comfortable using the system. In order to increase efficiency and precision, our group thought that if the thermocycler and flourimeter was one entity together, it would take the pain out of PCR. By combining these two machines, there is no need for bulky lab equipment or wasting time for set up. Our design also analyzes the samples which also increases efficiency. In our new design, after the thermocycling process, SYBR green is added to the samples and they are placed in to a second compartment in the machine that uses a photo diode to measure florescence in the sample. With our design, PCR is streamlined and pain-free.
Feature 1: Consumables The essential consumables for our PCR method are the liquid reagents, reaction tubes, pipette tips, and measuring devices, specifically
Our kit will rely on color coordinated steps and consumables that are pre-measured, or, fixed to a certain measurement. The steps in which the consumables are used are assigned a number and the procedure proceeds in number order (ex - 1, 2, 3, 4, 5...) An explanation of the steps in the image above labeled 1, 2, and 3 follows.
We redesigned the consumables in this manner because of several weaknesses we found with the OpenPCR system. First, obtaining the correct volume of a sample or reagent at a specific stage can drastically effect a reaction. Our redesigned micropipettors measure to a fixed volume and are color-coordinated with the tubes for easy transfer. Another weakness we found with the OpenPCR system was keeping track of the steps involved in mixing which reagents. Our numerical steps and color coding simplify and illustrate the process being carried out at each point in the procedure. Lastly, our re-designed consumables cut down on waste, chemical and material, because the is greater sample recovery for our pre-set micropipettor and pre-filled reagent tubes. Feature 2: Hardware - PCR Machine & FluorimeterIn our system, the Open PCR machine and fluorimeter are rolled into one seamless system. The samples will be loaded into the machine and then the machine will carry out the thermocycling process. Instead of transferring these samples to a second device (the fluorimeter) the samples will be analyzed in the machine. The samples will removed from the thermocycling area and SYBR green will then be added to the samples. In a second area of the machine, a photo diode will measure the florescence of the samples. A major weakness of the old system is that multiple machines are needed to run one single Open PCR reaction. The cost of purchasing all the needed materials for the machines and the machines themselves can add up. If these machines were streamline into one single machine, this would save individuals time and money. Another flaw in PCR reactions is the need for skilled professionals who know how to operated the equipment and analyze the samples. With our streamlined design, running a PCR reaction is easier than it has ever been, allowing more people to run open PCR reactions.
| ||||||


