BME100 f2016:Group2 W1030AM L6
| Home People Lab Write-Up 1 | Lab Write-Up 2 | Lab Write-Up 3 Lab Write-Up 4 | Lab Write-Up 5 | Lab Write-Up 6 Course Logistics For Instructors Photos Wiki Editing Help | |||||||
|
OUR COMPANY
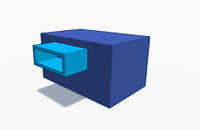
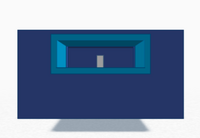
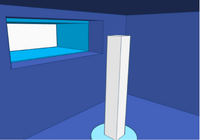
Our Brand Name LAB 6 WRITE-UPBayesian StatisticsOverview of the Original Diagnosis System During the lab, 34 patients were observed by 17 teams of 6 scientists. Every team was assigned two patients to overlook and diagnose for the SNP disease. Varying things were done to get rid of any type of error that might have occurred during the lab. A total of three replicates were used for each patient and performed three samples per patient. Certain PCR control standards were upheld including not reusing tips, making sure the phone used was five centimeters away from the system. Several pictures were also taken to get optimal ImageJ data. In order to produce a more accurate average of the drops, 3 images were used in the IMageJ program. These images used the same settings that the lab notebook prescribed. The class data resulted in three inconclusive data tests, 7 positive and yes tests, 13 negative and no diagnosis and 26 total tests with ‘No test’ not included. However, there were 4 ‘No test” or blank data points in the class spreadsheet. Due to ‘Inconclusive tests’ and ‘No tests’, it was difficult to fully analyze the consistency of the results. Other errors included not being able to get a completely accurate ImageJ procedure since making an outline on the oval was not fully precise. What Bayes Statistics Imply about This Diagnostic Approach Calculation number one looks at the probability that a patient will be having a positive final diagnosis for the disease. The percentage obtained was about an 80% which shows that there is a fairly high probability. Calculation number two describes the probability that a patient will be having a negative final diagnosis. For this, a high percentage of almost 100% was obtained. These two results indicate that the tests are quite reliable. Intro to Computer-Aided Design   3D Modeling
Feature 1: ConsumablesIn our analysis of the weaknesses, we noticed that in order to do a PCR lab, there are many steps that are quite time consuming. Therefore, we developed a way to cut down on the amount of steps to prepare the DNA and also to cut down on the amount of plastics and used in the lab. In order to improve the consumables kit in our lab, we decided to decreases the amount of steps for the lab which will reduce the amount of containers, pipette tips, and plastics used to prepare the solutions. Primers, water, and DNA are initially separated in the lab. We will focus on adding the primer to the other elements of the lab which will then be sold to other companies. This will improve the consumables by requiring less plastics and it will also decrease the amount of steps for the lab technicians. The primer will be initially added to the PCR promega mix (buffer with specific salts to maintain pH, MgCl2, taq polymerase, nucleotides (ATCG)). The final concentration must be = 1 micromolar in final reaction, therefore, the primers have to be packaged as 2M concentration. Since the consumables come premixed with the primers, each mix sold will be for a specific disease. Overall this effort reduces the need to dilute, packaging plastics, pipette tips and it cuts down on plastics to use to create mix which will overall decrease the cost for students and teachers purchasing our products. Feature 2: Hardware - PCR Machine & Fluorimeter  PCR Machine: In our analysis, the PCR machine’s immobility was a weakness. To improve that weakness, we would change the PCR machine to include a battery to take it wherever the machine is needed. The battery will be solar powered. The solar cells will be lined along the outer wall of the PCR machine. We included a battery so that the PCR machine will recharge itself as long as there is sunlight. We included a solar powered battery in the effort to enhance the PCR machine's portability and convenience.
| |||||||


