BME100 f2016:Group1 W8AM L6
| Home People Lab Write-Up 1 | Lab Write-Up 2 | Lab Write-Up 3 Lab Write-Up 4 | Lab Write-Up 5 | Lab Write-Up 6 Course Logistics For Instructors Photos Wiki Editing Help | ||||||
|
OUR COMPANY
AMBES LAB 6 WRITE-UPBayesian StatisticsOverview of the Original Diagnosis System BME 100 tested 34 patients for the disease-associated SNP by giving 17 groups of 6 students each 2 patients to test. Each group was responsible for testing the samples of DNA from their patients and calculating the DNA concentration in ug/ml of the DNA samples. The DNA had to be run through a PCR machine after a PCR reaction mix was added. This replicates the specific strand of DNA code being tested for in the experiment. Syber-green chemical is added to the samples of DNA and then observed together through a blue LED light. Syber-green reacts with the DNA strand being tested for, and glows in the blue LED light if it is positive. The strength of the glow depends on the concentration of the DNA, thus DNA samples of known concentration were tested and used to create a calibration curve. The patients’ DNA samples were compared to this calibration curve and the concentration was calculated. The concentration as well as the visual “glowing” verses “not glowing” results when the sample was in the pathway of the blue LED light lead to the results of either positive or negative for the patient’s DNA results. Each sample of DNA was tested 3 times, and multiple images of each sample in the blue LED light were taken to ensure that the most accurate results were collected. When all 17 groups compared data, the test showed to have a 48.7% chance of being positive, and a 51.3% chance of being negative. However, a positive result in one test of the patient’s DNA had a 86.8% chance of a positive overall PCR result and a negative result of one test had a 90.0% chance of a negative overall result. Since the percentages were not 100%, meaning 100% accurate, running more tests increases the certainty of the results of the lab. Errors could have occurred at every stage in the process of testing the samples, hence why there is not 100% certainty in the results, however the uncertainty is minimized by doing multiple tests.
The first calculation is regarding the accuracy of the positive test results. The value we got was close to 85%, meaning that if a patient gets a positive test result, there is only an 85% chance that this result is accurate.
The second calculation, concerning the negative results, were about 10% more accurate, so if a negative result is found, there is about a 95% chance this is accurate.
The third and fourth calculations are regarding the percentage of patients that receive a positive test result actually developing the disease. For positive results, our accuracy was only about 63%, meaning that even though a big percentage of the positive results were false positives. The negative results were more accurate by about 20%, so again the negative results were more accurate than the positive.
Intro to Computer-Aided Design3D Modeling
Feature 1: ConsumablesUpon examining the consumables aspect of the PCR process there were a few things that could have been done differently. There was a lot of waste with the micro pipette tips. If the tips of the micro pipette tips were biodegradable then the waste aspect here could be resolved. Also resolving the issue the tubes containing reagents and the cuvettes are two different things. If there was a heat resistant cuvette this could be used for the entire process of PCR instead of over using materials.
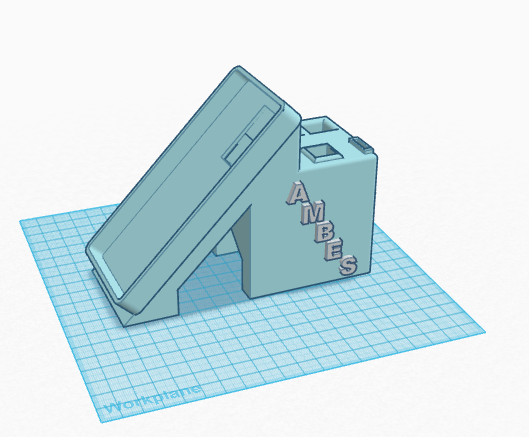
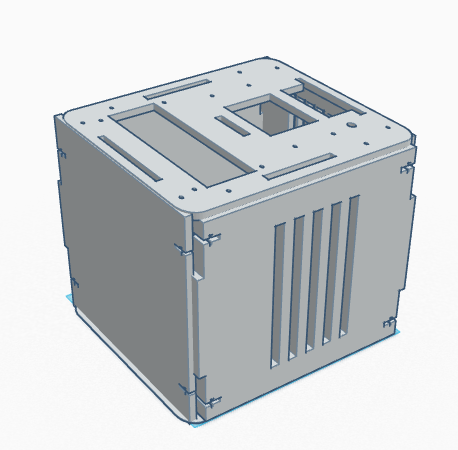
Feature 2: Hardware - PCR Machine & FluorimeterFor the fluorimeter, we will be using the Specphone design, which keeps everything in place and allows for a light to be shined through the sample material and into the phone's camera lens. This will take the place of the stand-and-box design that we used last time to keep light out and hold the camera in place.
| ||||||


