BME100 f2016:Group16 W8AM L3
| Home People Lab Write-Up 1 | Lab Write-Up 2 | Lab Write-Up 3 Lab Write-Up 4 | Lab Write-Up 5 | Lab Write-Up 6 Course Logistics For Instructors Photos Wiki Editing Help | ||||||||||||||||||||||||
|
OUR TEAM
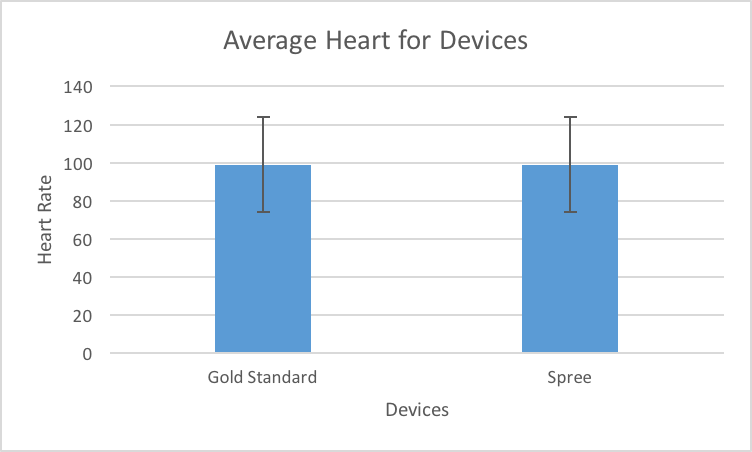
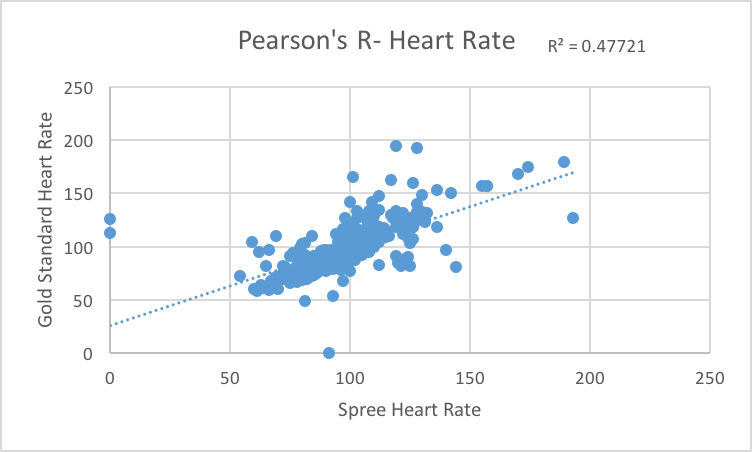
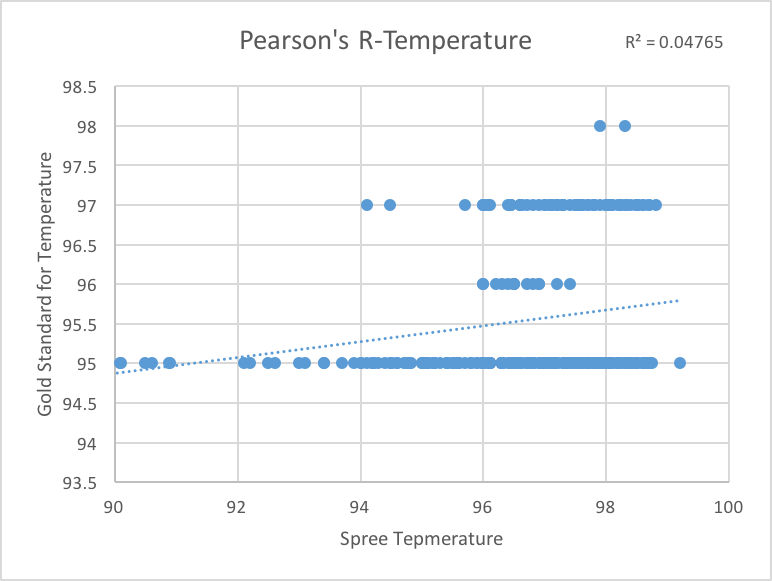
LAB 3 WRITE-UPDescriptive Stats and GraphData for Heart Rate:
Pearson's R: 0.690806489 Data for Temperature:
Pearson's R: 0.218299305
Inferential StatsA paired T Test was complete for both the heart rate and temperature data. Data for Heart Rate: P-value: 0.427116193 Data for Temperature: P-Value: 2.69552E-20
Design Flaws and RecommendationsThe design of the Spree Headband is not aesthetically pleasing. The device is not appealing to athletes and the common gym goer, because of the device being a large headband that is not fashionable or comfortable to wear while working out. The next flaw is the differences between the Spree and the gold standard for heart rate monitoring. The P value of the Spree for the heart rate monitor was around 0.4, which indicated a significant difference between the Spree and the gold standard for heart rate monitoring. This difference shows that the Spree headband does not function properly as a heart rate monitor, indicating a significant flaw in the product.
Experimental Design of Own DeviceFor the experimental design of our device we will choose one randomly selected person to participate in our experiment. A medical check up will be required to ensure that the participant is healthy to participate. After cleared, we will have our participant sit in a chair with the BAC Out band on their wrist. Then they will take seven 1.5 ounce shots of 40% ABV vodka. The participant will remain seated for the whole two hours to prevent variables that are not being tested form interfering. We will record an initial reading before the alcohol is consumed, then every ten minutes for two hours the blood alcohol reading on the BAC Out band will be recorded, then the participant will blow into a police grade breathalyzer to compare the accuracy of our product. After the two hours are up, the data will be compared to determine if our product measures blood alcohol concentration as accurately as the top of the line breathalyzers to ensure the safety of the customers of our product. | ||||||||||||||||||||||||


