BME100 f2016:Group15 W1030AM L5
| Home People Lab Write-Up 1 | Lab Write-Up 2 | Lab Write-Up 3 Lab Write-Up 4 | Lab Write-Up 5 | Lab Write-Up 6 Course Logistics For Instructors Photos Wiki Editing Help | ||||||||||||||||||||||||||||||||||||||||||||||||||||||||||||||||||||||||||||||||||||||||||||||||||||||||||||
Group still avoiding freshman 15
LAB 5 WRITE-UPPCR Reaction ReportSummary: Through the experiment, it was helpful to have read the pre-lab reading beforehand as well as having it while doing the trials. This was because the process of pipetting and using the samples was known before the experiment and there was less chances for error to occur during the experiment. The pre-lab made the difference between the first stop and the second stop very clear, so it may have helped measurements be more accurate overall. In general, the final amounts of each mixture were similar, but at times weren't exactly the same. This may have been due to a slight mistake in pipetting or there may have also been a bubble that formed in the pipette.In general, there was no liquid left in the tubes for the DNA samples, but there was still leftover PCR Reaction mix that could have been used. We did not have to change our labeling scheme and it stayed the same through both of the experiments. Fluorimeter ProcedureImaging set-up
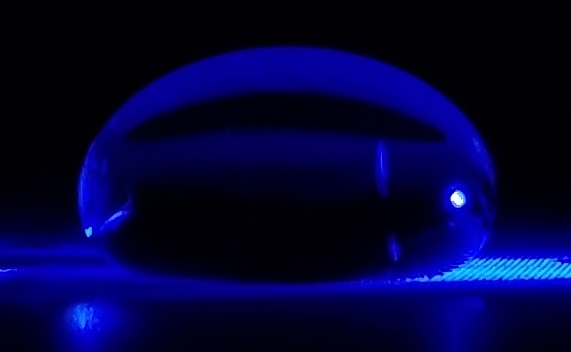
Placing Samples onto the Fluorimeter Step One: Place a 160 microliter drop of water (H2O) in the middle of the first two rows of the slide using the pipettor so that the drop is pinned and looks like a beach ball. Step Two: Turn on the excitation light using the switch for the Blue LED. Step Three: Turn on the camera of your smart phone and check the settings on the smartphone Step Four: Place your smart phone on the cradle at a right angle from the slide. Step Five: Adjust the distance between the smartphone on its cradle and the first two rows of the slide so that it is as close as possible without making the image blurry. It should be at least 4 cm away from the drop. Step Six: Record the distance between your smart phone cradle and drop using the ruler provided in lab. Be careful not to move the camera, cradle, or fluorimeter very much. The light collected will change slightly if there is a significant difference from one image to the next in these distances. Step Seven: Place a 80 microliter drop of SYBR GREEN I in the middle of the first two rows of the slide using the pipettor so that the drop is pinned and looks like a beach ball. Step Eight: Align the drop by moving the slide so that the blue LED light is focused by the drop to the middle of the black fiber optic fitting on the other side of the drop. Step Nine: Use the timer on your camera so that you can take a picture after covering the fluorimeter and camera with the light box. Step Ten: Take three images of the drop being careful to check that drop is focused. Step Eleven: Use the pipettor to remove the 160 microliter drop from the surface and move the slide to the next position. Step Twelve: repeat these steps for the other concentrations.
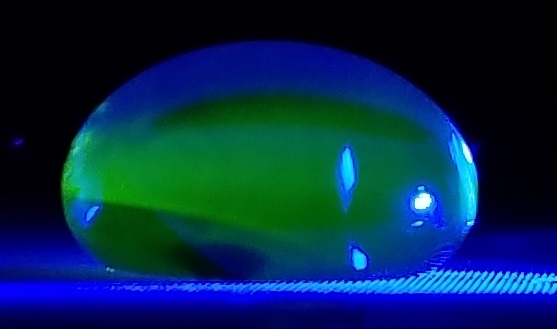
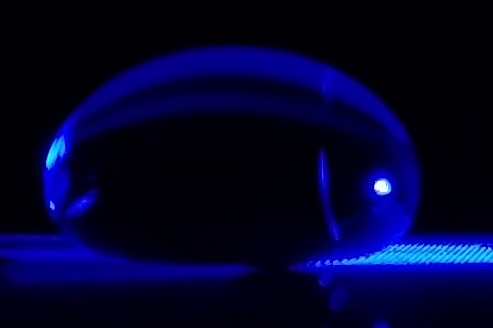
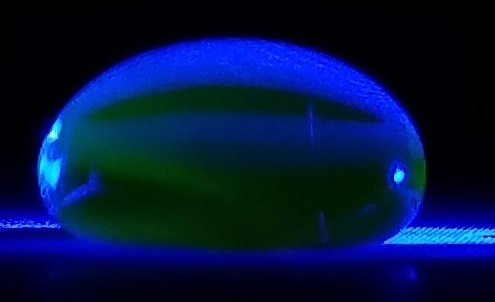
Data Collection and AnalysisImages of High, Low, and Zero Calf Thymus DNA
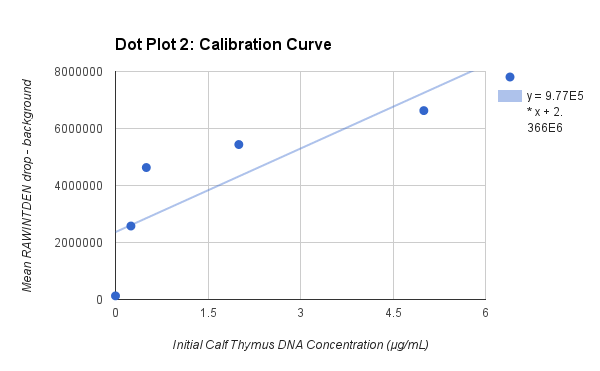
PCR Results: PCR concentrations solved
PCR Results: Summary
| ||||||||||||||||||||||||||||||||||||||||||||||||||||||||||||||||||||||||||||||||||||||||||||||||||||||||||||


