BME100 f2016:Group13 W8AM L3
| Home People Lab Write-Up 1 | Lab Write-Up 2 | Lab Write-Up 3 Lab Write-Up 4 | Lab Write-Up 5 | Lab Write-Up 6 Course Logistics For Instructors Photos Wiki Editing Help | ||||||
|
OUR TEAM
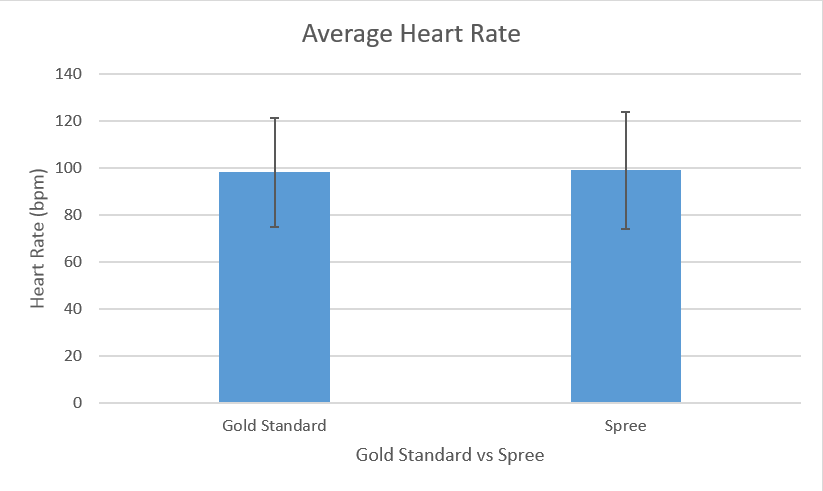
LAB 3 WRITE-UPDescriptive Stats and GraphHeart Rate (Gold Standard) Inferential Statsp-value (Heart Rate): 0.4270
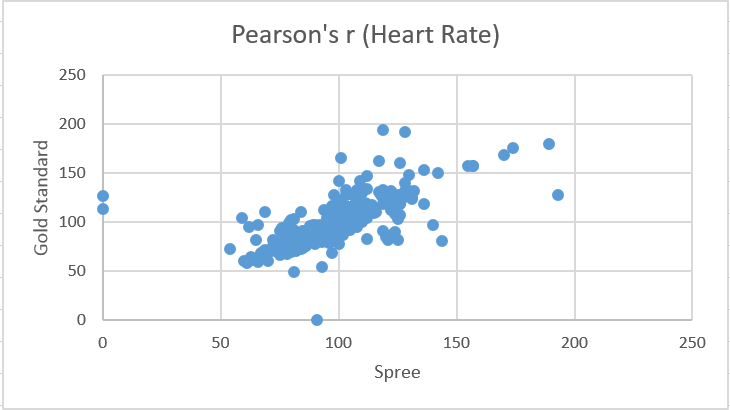
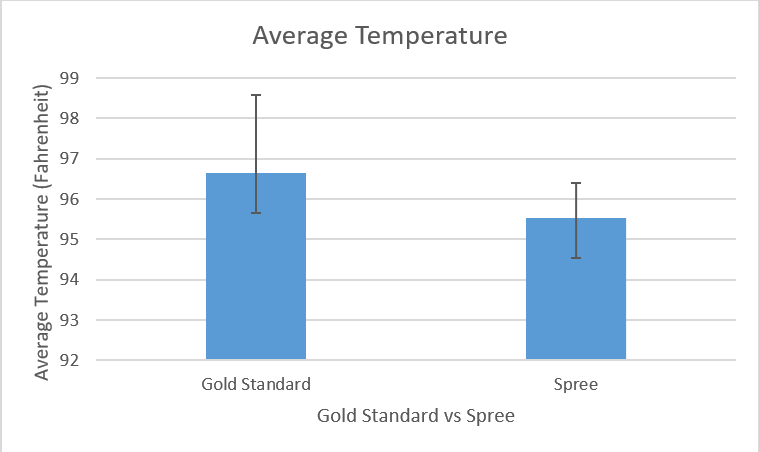
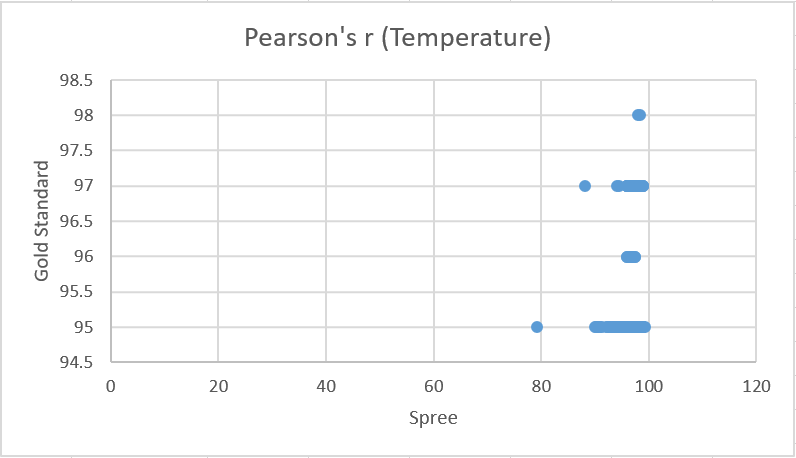
Design Flaws and RecommendationsWhen compared to the Gold Standard, the Spree devices did a good job of collecting data for heart rate and a poor job of collecting data for temperature. From the Pearson’s test for heart rate it can be seen that the Gold Standard data has a moderate correlation with the Spree device’s data, as the coefficient value is slightly more than 0.5. Conversely, the Pearson’s test for temperature shows almost no correlation between values, as the coefficient is very close to 0.
Experimental Design of Own DeviceThe emphasis in this experiment will be to prove that our wireless function electronic stimulation device (FES) coupled with our application for the patient's tablet or smartphone will provide the same benefit as standard FES products on the market while providing a much better quality of life to patients. FES devices have been clinically tested and proven to work, because of this, we have decided that a current FES devices used in physical therapy would be an appropriate gold standard in measuring the efficiency of our device. This experimental design will have a focus on stroke patients specifically. To find the appropriate groups and sizes to test our product on, we need to look at the data that had been previously gathered on stroke patients. Patient 65≥ make up almost 65% of the current stroke population1, so in order to find the most accurate data, a similar corresponding percentages would need to be included in the experiment. Other important considerations would include where the patients are currently living as well as time since hospitalized for their stroke. In order to provide a control in this experiment only patient who have a similar time since their stroke will included in the experimental design. The thought behind this is that, while each patient suffered different severities of stroke and have different disabilities resulting from the stroke, this time blocking will allow us to eliminate possible outliers due extended time after stroke. Once the appropriate number of patients have been selected to participate in the experiment, the patients will be split randomly into two groups. Group A will be first treated using the gold standard. Then after the first trial period with the standard device, the patients will be switched to our wireless device and treated for the same time. Group B will be treated first using our wireless FES device. Then corresponding to the switch in Group A, Group B will be treated for using the standard FES device.The rationale for splitting patients into groups, is that once the patients begin treatment, recovery or functionality of an appendage maybe exponential but could possible flatline overtime. Thus, by having two different groups, one starting with the gold standard, and the other with our wireless FES device, we can hopefully eliminate a possible skew in the data. During the entire process that that we were designing our product, simplicity and convenience for the user has been incredibly important, this lead us to the point that we would need to use both quantitative and qualitative data to prove the benefit of our device compared to that of the gold standard. In order to measure the qualitative data or how our device would benefit the quality of life for the patients, we will be using an attitudinal survey and it will be measured using nonparametric statistics. The survey will be give to each group a total of three times. First, at the beginning of the trail. The second would be given half way through after treatment with the first device. And the third survey would be given at the end of the trial, after the treatment with the second device. For the quantitative data, both a pair and unpaired t-test would be used to measure the data. The paired t-test would be useful in interpreting the data from within that was collected from Group A and Group B. The pair t-test would give insight to the understanding the differences after switch from the first treatment device to the other. The unpaired t-test would be used to measure the data between Group A and Group B. A Pearson’s r would need to result in a >.05, proving that our devices efficiency is almost equal to that of the gold standard. CITED Hall MJ, Levant S, DeFrances CJ. Hospitalization for stroke in U.S. hospitals, 1989–2009[PDF-322K]. NCHS data brief, No. 95. Hyattsville, MD: National Center for Health Statistics; 2012. | ||||||


