BME100 f2016:Group11 W8AM L6

From OpenWetWare
Jump to navigationJump to search
BME 100 Fall 2016 Home
People
Lab Write-Up 1 | Lab Write-Up 2 | Lab Write-Up 3
Lab Write-Up 4 | Lab Write-Up 5 | Lab Write-Up 6
Course Logistics For Instructors
Photos
Wiki Editing Help


P.A.N.D.A.

Name: Erik Ireland
Name: Isaac Alemu
Name: Maria Predtechenskaya
Name: Elmer Correa
Name: Zach Mizera
Name: student

Our Brand Name

LAB 6 WRITE-UP

Bayesian Statistics

Overview of the Original Diagnosis System


In BME 100 students were divided into 17 teams of 6 students that diagnosed 34 patients total. Each group had 2 patients' DNA samples that had to be processed.

There were a couple of error precautions that we did. For each patient there were three runs that were done so that there will be less errors. Then the PCR controls were all done by a machine, so that excluded human error. The ImageJ calibration controls were done on the computer; there was little human error present there - only drawing the area of the drop as accurately as possible. Three images per each drop were taken so that the results would be an accurate representation as to whether the drop actually fluoresced or not.

Of our results we had two patients with blank data. Then, there were 6 slots with inconclusive results. We had 13 positive and 15 negative test results. There were 7 results that were completely wrong out of 30 tested.


Some problems that affected our data was that some groups did not do some tests for a patient (so only 30 patients were tested). Also, some results were inconclusive (there were six of these total) so the error percentage grew with those. Our data could have been affected by confusing some images for what they were not - the images got switched, and this is why our group could have gotten switched results.


What Bayes Statistics Imply about This Diagnostic Approach


For Calculation 1, the patient will get a positive final test conclusion, given a positive PCR reaction, in 89% of the cases (about 90%). For Calculation 2, the patient will get a negative final test conclusion, given a negative diagnostic signal, 102%. From these Bayes values, we can conclude that the test gives the negative final conclusion if there is a negative signal extremely well. It detects whether the conclusion is positive based on the positive signals decently as well (9 out of 10 times it gives a positive conclusion if there is a positive reaction). Therefore, the sensitivity (seen in Calculation 1) and the specificity (seen in Calculation 2) are very fine tuned. This means that overall, the test that detects the reactions should be trusted most of the time.


For Calculation 3, the patient will develop the disease, given a positive final test conclusion, in 65% of the cases. For Calculation 4, the patient will not develop the disease, given a negative final test conclusion, in 84% of the cases. The sensitivity to predict the disease (given by Calculation 3) are moderately accurate while the specificity of the system to predict the disease (given by Calculation 4) is much better. From these numbers we see that there are many false positives and only in about 1 out of 2 cases does the test actually identify the SNP disease. This means that the test is not very accurate and should be confirmed with a better, more accurate test. The test does much better in determining that the person does not have the disease. About 4 out of 5 people who do not have the SNP disease get results that they do not have it. Yet, there is a false negative 1/5 times. So, these results, too, should be taken with a grain of salt.


There were possible sources of error that gave us these results. For one, not always was a correct amount of the PCR mix was transferred to the new tube, causing there to be less enzymes, and less of the copying of the DNA, giving negative results; this is a human error. Another possible error was mislabeling, cross-contaminating the samples, or switching the images of the drops during analysis (human error). This would jeopardize the data collected. Finally, the drop on the slide was not always aligned properly, so less light could have shined on the drop, giving negative results, while they were actually positive (this is a human error causing variability and inaccuracy). All of these sources of error could have happened, giving us altered results that do not portray the test well.

Intro to Computer-Aided Design

3D Modeling


Our Design


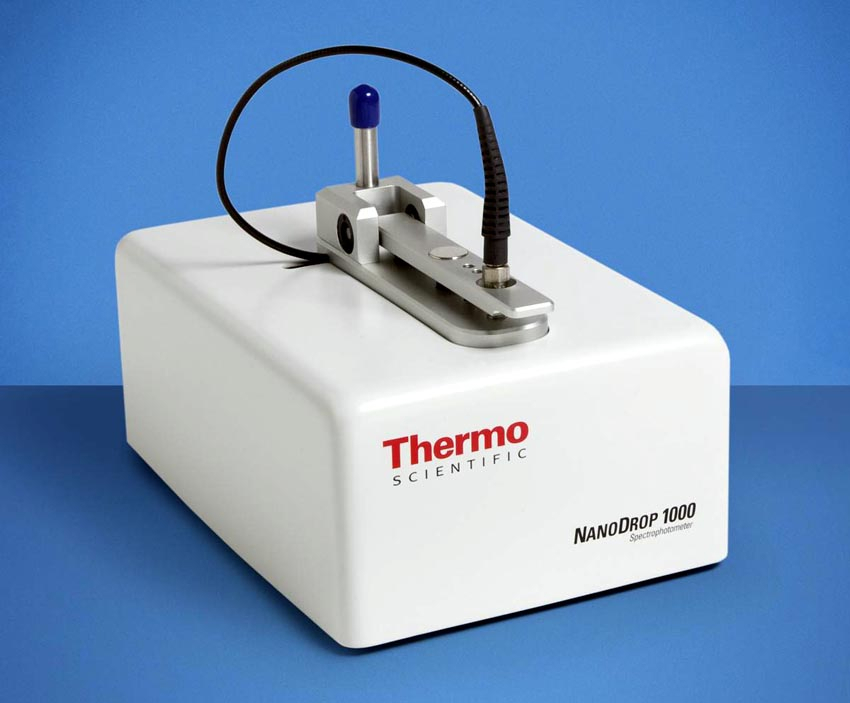
Our product design is different from most due to it using a nanodrop to measure the presence of DNA in the droplet. By using a nanodrop it not only is able to accurately measure the amount of DNA in the droplet, but is also able to cut down on the time needed for the PCR to take place. The main reason the PCR can be shortened is becasue the droplet measured is so small that it does not require a large yeild of DNA. On top of this the nanodrop can measure concentrations as low as one microgram per microliter. This all takes place inside the device where the nanodrop machine is intefrated. The product is also similar to a printer, meaning that the samples are loaded into the device like ink cartrages, and one they are loaded they device will do the rest of the process automatically. Overall the product is designed to cut down on time needed for accurate results and man power needed to preform the tests.


Feature 1: Consumables

Very important consumables are ones that are required to do one experiment. Without them, the experiment cannot be done.


We are redesigning the fluorimeter aspect of the procedure. Thus, we will not be using the consumables, such as slides, that are usually necessary for the fluorimeter to process the data. The technology will be similar to this: http://www.nanodrop.com/productnd8000overview.aspx

Instead, we will be using a spectrometer nanodrop device which is built into the device and so eliminates any need for SYBR green dye, for example. The complete and total automatic nature of the device also eliminates the need for micropippettes which are reusable within the internal mechanisms of the machine.


Our kit will provide PCR mix, dNTP's and disease specific primers depending on the request of each individual client.

  • dNTPs

These of course will be required to build the many replications of a diseased section of DNA and will be included and place in its specific cartrage during testing. This will likely end up being the limiting reactant in each experiment and so a suitable amount will be placed according to the needs of our client.

  • PCR Mix

This will include the taq polymerase required to build the extra strands of DNA during the thermocyling with a new batch required for every new test. This will be a critical component of the reaction and will certainly come with every kit of the device in adequate supply.

  • Primer Solution

Disease specific primers will be included according to the individual needs of each client. This will depend on what disease is primarily being tested, though it is expected that a large amount of hospitals will purchase our product. For this, we will have a special edition kit that includes a broad spectrum of primers in order to appropriately meet the unpredictable demand of an emergency room or several hundred long term patients.

  • Micropippette

This will also be included as a courtesy for the step that will require a sample of a patient's DNA to be inserted into the PCR Mix. We will also include the option of not ordering this product along with pippette tips as these will be likely already owned by the hospitals and research institutions that will purchase our product.

Feature 2: Hardware - PCR Machine & Fluorimeter

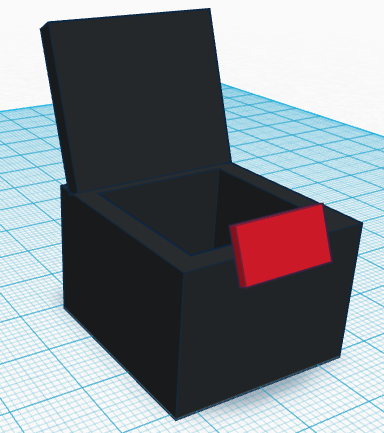
A major weakness that our device addresses is the slow time and tedious nature of receiving results primarily caused by the fluorimeter method. We will be excluding it altogether and instead incorporate a nanodrop spectrometer into the device with results that can be transmitted by Bluetooth onto an app or computer. This will reduce the number of thermocycles required for testing as the nanodrop device can detecty far lower concentrations than can be using the fluorimeter in the original method with the vanilla OpenPCR. We will also augment the device by creating a tray that will work similarly to a printer with trays for PCR mix, primer solutions, etc. with it all being mixed in precise amounts internally with mechanized micropipettes. Once the mix is prepared a vacuum tube will send it to the thermocyler and will then afterwards be delivered to the nanodrop machine for final analysis. The color will be changed to black. Other than this, the design of the OpenPCR will reamain unchanged. In order to accomadate all the extra hardware, it is worth noting that the device will likely be larger and heavier than its predecessor.

Nanodrop Machine:

Source: U. (2014, April 23). NanoDrop. Retrieved November 21, 2016, from http://gcf.uta.edu/Nanodrop.html

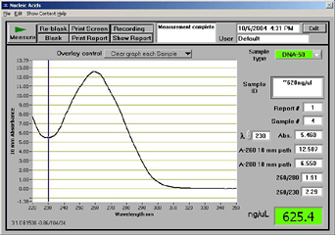
Results Example:

Source: Nanodrop Spectrophotometer. (2010, March 14). Retrieved November 21, 2016, from http://dnatech.genomecenter.ucdavis.edu/nanodrop-spectrophotometer/