BME100 f2016:Group10 W1030AM L6
| Home People Lab Write-Up 1 | Lab Write-Up 2 | Lab Write-Up 3 Lab Write-Up 4 | Lab Write-Up 5 | Lab Write-Up 6 Course Logistics For Instructors Photos Wiki Editing Help | ||||||
|
OUR COMPANY
Our Brand Name LAB 6 WRITE-UPBayesian StatisticsOverview of the Original Diagnosis System
What Bayes Statistics Imply about This Diagnostic Approach
Each of these calculations were examined in terms of direction relation to the system and detection or prediciton of the disease SNP. The calculation that describes the sensitivity of the system
regarding the ability to detect the disease SNP was Calculation 1, while the calculation that describes the sensitivity of the system
regarding the ability to predict the disease was Calculation 3.
Similarly, the calculation that describes the specificity of the system
regarding the ability to detect the disease SNP proved to be Calculation 2 and
the calculation that describes the specificity of the system
regarding the ability to predict the disease was evidently Calculation 4. Possible sources of error could have been irregular transfer amounts due to misuse of the micropipette, light exposure during shutter release when capturing photos of droplets, and distance inaccuracies of the camera and the slide. Another source of error may have been a cross contamination of samples or by the subjects conducting the procedure. Intro to Computer-Aided Design3D Modeling The team decided upon the use of SolidWorks due to the program's ability to design in great detail and provide a variety of views for examination of the assembly. Though the program requires constant learning and searching for new methods to create the design in mind, this truly allows for the most precise design possible. SolidWorks allows the user to determine materials, colors, depths, and technical blueprints for each part created. Beginners in terms of learning the program, these details provided slight challenges in the computer-aided design but these challenges were overcome with dedication and focus on the goal at hand. The use of the computer to propel design methods was extremely influential and will be beneficial in future creations.
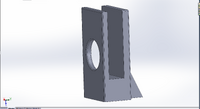
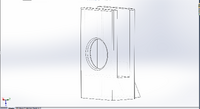
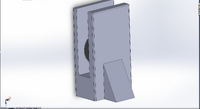
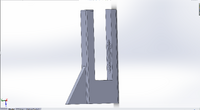
Our Design Phone Holder
Labeling Improvement
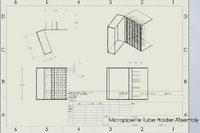
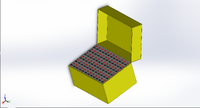
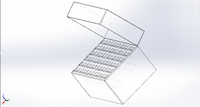
Feature 1: ConsumablesIdentification of liquid reagents is very important when trying to avoid cross contamination of samples. One major obstacle was initially identifying samples as the writing implement used on the slick plastic tube, had a tendency to rub off easily or smear making the tube identification very difficult. Accurately documenting what solutions and primers were Incorporated with the PCR mix is of crucial importance when working with a variety of samples and solutions. Current plastic pipette tubes lack the ability accurately and consistently identify samples in use. Our solution was to create a 50 tube holder that offers colored labels at the base of each tube holder. In this case one tube is used at a time eliminating any issues with placement inconsistencies. This new tube system will allow for a reusable base, offering options of correlating colors and a larger area for writing tube identities.An example of how this system will be used will be a red sticker on the Primer solution tube. This tube is placed into the slot that houses the red sticker on the base that also has the written identification of the product. These consumables will offer options for orders of not only the bases but the option of reordering just stickers or coded tubes as well.There will be the option to order stickers that offered in a variety of symbols and colors as well as offering side products such as legend sheets for more extensive work. Feature 2: Hardware - PCR Machine & FluorimeterOur Open PCR system included a change in the fluorimeter, but the Open PCR machine remained the same. Since we had to take pictures at different distances for the fluorimeter, the results were constantly changing with every test. To remove this error in the Open PCR system, we designed a phone holder that will guarantee the same distance for each picture taken. To stabilize the phone, we used hardware that can hold any phone with or without a case. The phone holding stand measures a distance of 4 cm away from the fluorimeter and there is a hole that allows researchers to place their phones within it.
| ||||||


