BME100 f2014:W Group2 L3
| Home People Lab Write-Up 1 | Lab Write-Up 2 | Lab Write-Up 3 Lab Write-Up 4 | Lab Write-Up 5 | Lab Write-Up 6 Course Logistics For Instructors Photos Wiki Editing Help | |||||||
|
OUR TEAM
LAB 3A WRITE-UPDescriptive StatisticsTemperature
ResultsTemperature
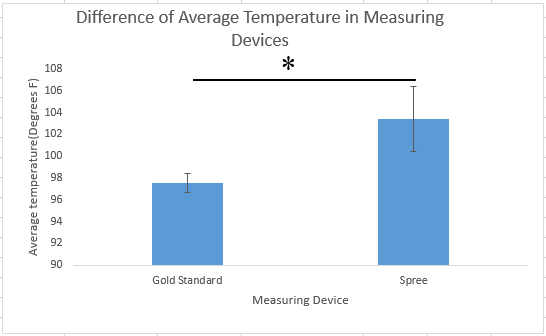
AnalysisTemperature A ttest was performed on the temperature data because the data compares two groups. The ttest produced a p-value of 6.35029712031846E-246 which is less than 0.05. Therefore, there is a significant difference between the gold standard temperature and the spree temperature. The Pearson's R value was -0.0250085429536513. Since the Pearson's R value was nearly zero, there is no correlation in the data.
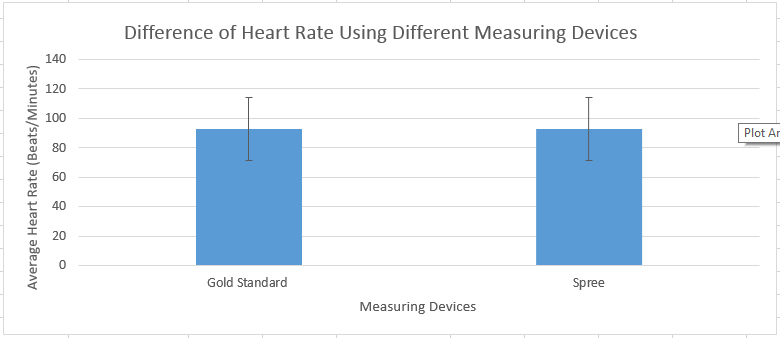
A ttest was performed on the heart rate data because the data compares two groups. The ttest produced a p-value of 0.494860469 which is greater than 0.05. Thus, there is no significant difference between the gold standard heart rate and the spree heart rate. The Person's R value was 0.897446. The Person's R value is close to one, so there is a positive correlation in the data.
Summary/Discussion
LAB 3B WRITE-UPTarget Population and Need
Device Design
Inferential Statistics
Graph
|
|||||||


