BME100 f2014:Group9 L3
| Home People Lab Write-Up 1 | Lab Write-Up 2 | Lab Write-Up 3 Lab Write-Up 4 | Lab Write-Up 5 | Lab Write-Up 6 Course Logistics For Instructors Photos Wiki Editing Help | |||||||||||||||||||||||||||||||||||||||||||||||||||||||||||||||||||||||||||||||||||||||||||||||||||||||||||||||||||||||||||||||||||||||||||||||||||||||||||||||
|
OUR TEAM
LAB 3A WRITE-UPDescriptive StatisticsTemperature values:
Pulse values:
ResultsInferential Statistics:
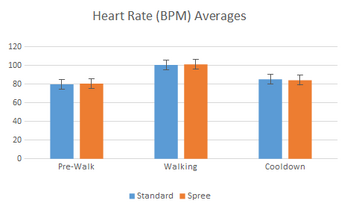
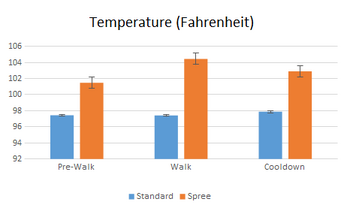
AnalysisIn terms of temperature readings, the Spree has an extremely low p-value, which shows that there is a large amount of variation in the reading of the standard and that of the Spree. This shows that it does not produce accurate readings. Also, the value for Pearson's R in this experiment shows that there is no real correlation between the values. However, the values for the heart rate show more accurate readings. The only trial which nearly possesses statistical significance is the post-walk/cooldown, as the p-value is .061. The Pearson's R for these tests are close to 1, so the values do correlate, unlike the temperature.
Summary/DiscussionSince both the p-value is extremely low, and how Pearson's R is close to zero for the temperature readings, it is clear that the Spree is not accurate in its readings. However, the measurements for heart rate are almost accurate, as the p-value for the tests are much closer to .05, and the Pearson's R is near 1. Yet, they are not close enough to hold significance. Overall, the Spree is a flawed device. One major design flaw is that it measures temperature externally, which is unlikely to produce a clear and consistently accurate result.
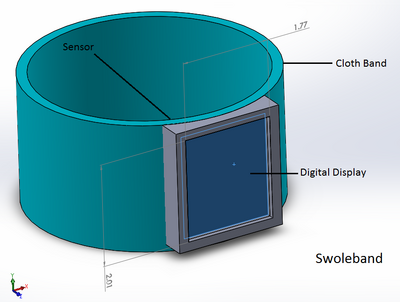
LAB 3B WRITE-UPTarget Population and NeedThe Swoleband is a new biomedical device which measures heart rate and levels of sodium and lactate (to derive a measure of lactic acid) in sweat. This device is targeted toward athletes, as the information it provides can help measure hydration and fatigue, along with physical exertion. The measure of sodium levels in sweat helps to maintain hydration, as a higher concentration typically means dehydration, which is necessary to avoid. The measurement of lactic acid provides information about how fatigued a person is, and it can help a person avoid overexertion. Also, this measure can be used to show that athletes are not exercising to a nearly full potential, so the device can tell them to keep going.
Device Design
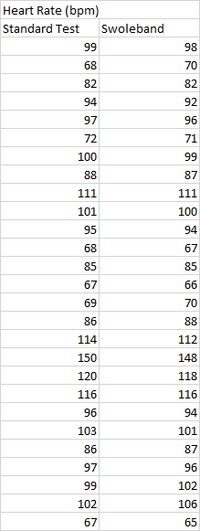
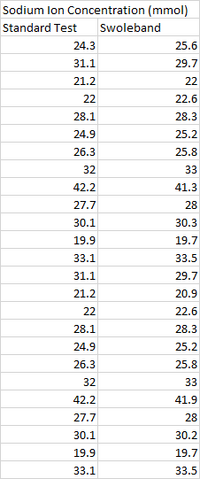
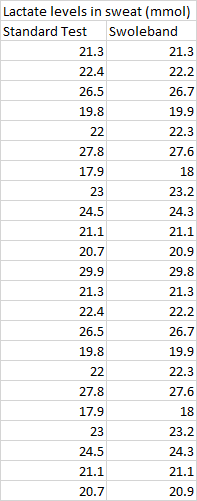
Inferential StatisticsData:
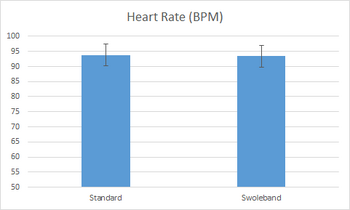
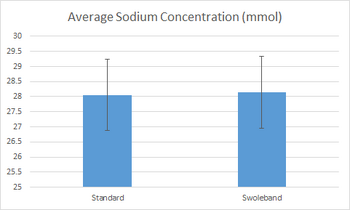
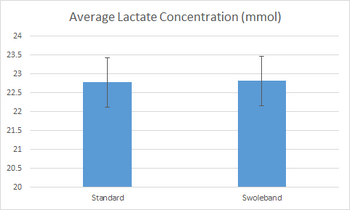
Since the p-values assigned by the t-test are much higher than .05, it shows that the data shows an extremely low difference between the two groups. This means that the device is highly accurate. The Pearson's R coefficient approaches 1, signifying that the data shows correlation.
Graph
|
|||||||||||||||||||||||||||||||||||||||||||||||||||||||||||||||||||||||||||||||||||||||||||||||||||||||||||||||||||||||||||||||||||||||||||||||||||||||||||||||

