BME100 f2014:Group8 L3
| Home People Lab Write-Up 1 | Lab Write-Up 2 | Lab Write-Up 3 Lab Write-Up 4 | Lab Write-Up 5 | Lab Write-Up 6 Course Logistics For Instructors Photos Wiki Editing Help | |||||||
OUR TEAM
LAB 3A WRITE-UPDescriptive Statistics
When it comes to temperature, this fairly drastic difference in standard deviation (14.75397 degrees for gold standard and 2.99257 degrees for Spree) can be attributed to the fact that the Spree device does not measure exact temperature. Rather, it measures approximate ranges. This provides significantly less accurate data than the Gold Standard thermometer which provides an exact temperature for each reading. The temperature data used for the Spree band was approximated to certain given degree values, and substituted in for the ranges (1,2,4, and 4). This allowed for the analysis of actual temperatures rather than ranges, but also provided false data, in a way. The ranges obtained from the Spree device were mostly the same value, so the same temperature value was averaged in multiple times. This would explain why the spree seemed to be much more consistent in measuring temperature than the Gold Standard thermometer. For heart rate, the standard deviation of the gold standard (20.50269 bpm) and Spree band (21.46775 bpm) were actually quite similar. This would indicate that the Spree was relatively accurate in measuring heart rate. Though the values themselves are rather unimpressive (a variance of 20 bpm is a large range), in comparison to the gold standard, the Spree is very accurate, and the range of values can be attributed to human error.
=ResultsAnalysis
When a t-test was run on the heart rate data, there was show to be a value of .216. This showed that while the data sets were correlated in some way, they were not entirely connected. After a Pearson's test was run on the same data, an r-value of -.074 was recorded. This shows that there is a very minor negative correlation in the data. These together show that while the device is close to the gold standard, the Spree headband is not extremely reliable. When a t-test was run on the temperature data, a value of 4.03 x 10^-56 was found. This shows that there is only an infinitesimally small correlation between these data sets. This value shows that the device is not even remotely reliable when it comes to measuring temperature data. When this device is looked at as a whole, showing both temperature and heart rate data, the Spree Headband is not a reliable measure of body status. This is due in part to the location, external, as well as the fact that the device gives only a slider bar instead of a number for both temperature and heart rate.
Summary/DiscussionWhile using the Spree headband, there were a few flaws we noticed with the design of this object. One of the most apparent flaw contained in this headband is the fact that it doesn't measure the exact temperature, but instead gives a range of what the temperature is closest to. This does not create accurate results as it only picks a certain range the temperature is around. The second design flaw noticed in this product is that it measures off temperature based off the user's skin, and not directly. This is not accurate because the skin does not depict the actual temperature of the user, since it can easily be affected by the environmental temperature. Another design flaw noticed while conducting this experiment is that is very uncomfortable and does not stay in place. For this product to be effective, it needs to be comfortable for the user so they wouldn't mind wearing it. To make this product better, there are many steps that can be taken. One measure that can be taken is to make the headband more appealing to the eye so more people would wear it and not mind it looking bad in public. LAB 3B WRITE-UPKidney disease is the 8th leading cause of death in the United States. Kidney disease kills over 90,000 Americans every year -- more than breast and prostate cancer combined. About ten percent of the population of the US have chronic kidney disease. This is an estimated 31 million people in America alone. Chronic kidney disease (CKD) is a condition in which your kidneys are damaged and cannot filter blood as well as healthy kidneys. This causes the wastes from the blood to remain in the body which leads to other health issues. Without treatment, diseased kidneys may stop working after a time, a condition called kidney failure. Kidney failure is also called end-stage renal disease (ESRD) or Stage 5 CKD. Once a person's kidneys fail they must either have regular dialysis treatments or have a kidney transplant. Dialysis is a process in which a machine filters the patient's blood, much like a health kidney would. Approximately 430,000 Americans are on dialysis at this moment. The most commonly run test which determines how efficiently the kidneys are functioning is the creatinine test. Creatinine is a waste product of the chemical Creatine, which provides fuel for the muscles in the body. The only bodily filter for creatinine is through the kidneys, and as such, as kidney function decreases in patients who are experiencing some kind of renal failure, the Creatinine levels in their blood will rise significantly. The results of Creatinine level tests must be analyzed on a case-by-case basis, taking into account gender and size, since muscle mass will affect how much Creatine exists in the body, and subsequently how much Creatinine by-product is formed. The Creatinine level reading is an ideal test for renal failure patients because it is relatively non-invasive, and does not cause many side-effects since it only requires a small blood sample. An alternate way to conduct a Creatinine level test is by collecting a patient's urine over the course of a 24 hour period. However, this process is time consuming, and leaves much more room for human error to be introduced. Therefore, the target of this product is an easier and more time efficient blood creatinine level test. The creatinine levels found in a patient's blood will be analyzed, and age, gender, and race will be factored in to find a patient's eGFR, or estimated Glomerular Filtration Rate. The eGFR provides a general picture of how efficiently a patient's kidneys are functioning. If the GFR value is found to be consistently low over a period of a few months and after multiple tests, this could be a warning sign to a doctor that a patient may be at risk of kidney disease or renal failure, and that their condition may require further medical attention. Target Population and Need
The current market for devices such as this includes expensive equipment which is slightly bulky to carry around. By integrating this device into a smart phone, the device can be cost effective and take up no more room than a large guitar pick. Device Design
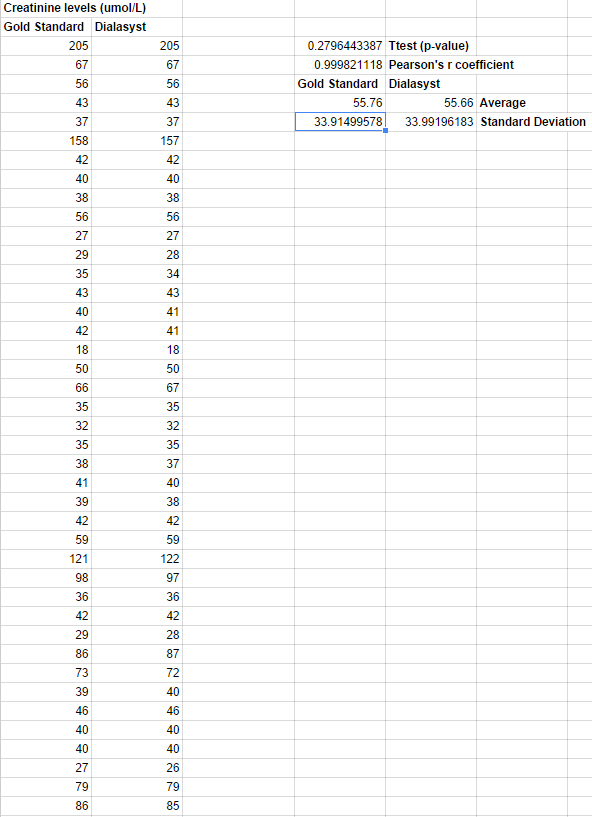
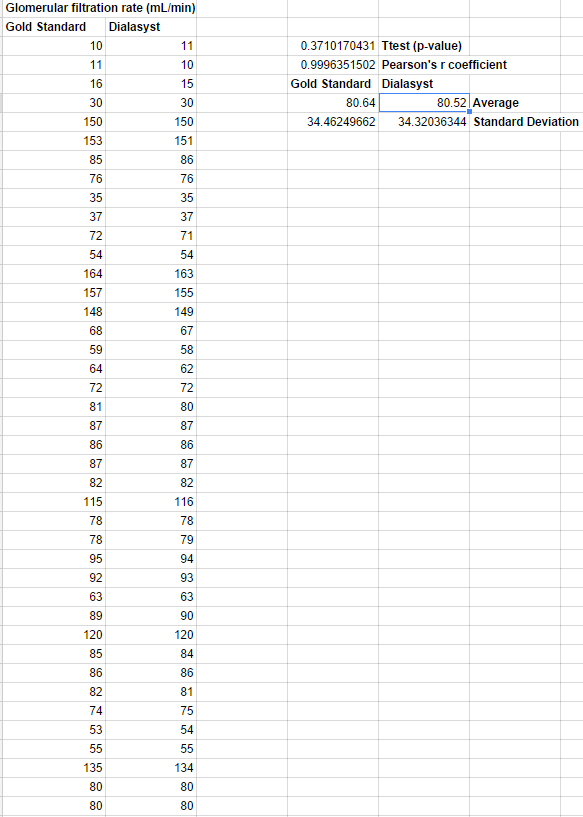
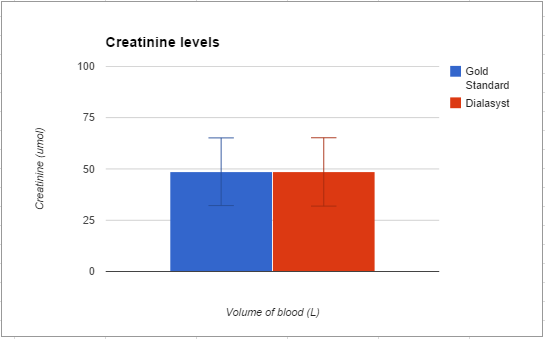
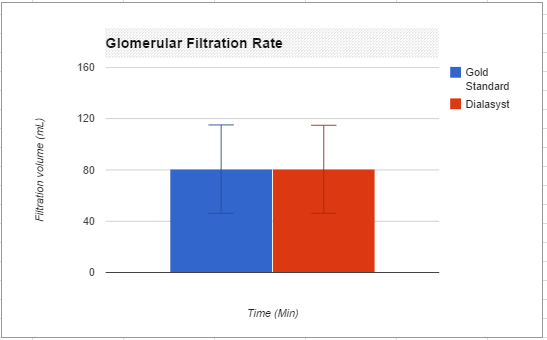
[[Image:Concentration chart bme100 lab 5.PNG] Once the data is analyzed, the app displays creatinine levels and GFR for the user. This data is encrypted before being backed up to the internet and is shared with whatever physician the user indicates while setting up their Dialasyst app. A secure network carries the data and requires specific keys for any doctor to access the information. Once the doctor has gained access to the Dialasyst's results, they are able to analyze if the patient is in immediate need of medical care, or if their levels are stable. Any spikes or troughs in the measurements result in an alert being sent to both the user and the physician. Inferential StatisticsWith a Pearson's r-coefficient of nearly 1 and an almost identical average, the Dialasyst is shown to be as accurate a measure of both Gloremular Filtration rate and Creatinine levels. The high standard deviation in both cases is explained by the fact that kidney's fail at slightly different rates, making it hard to find large sets of renal failure patients at exactly the same level outside of the traditional 1-5 stages. Graph |
|||||||


