BME100 f2014:Group4 L3
| Home People Lab Write-Up 1 | Lab Write-Up 2 | Lab Write-Up 3 Lab Write-Up 4 | Lab Write-Up 5 | Lab Write-Up 6 Course Logistics For Instructors Photos Wiki Editing Help | ||||||||||||||||||||||||||||||||||||||||||||||||||||||||||||||||||||||||
|
OUR TEAM
LAB 3A WRITE-UPDescriptive StatisticsThe final averages of the spree and the gold standard were calculated with the data from all 3 groups. The calculations included the 5 pre-walk readings, the 12 walking or exercise readings, and the 5 cool down readings. The tables below show the averages of the temperature and heart rate from the spree and the gold standard.
To measure the variability of the experiment the standard deviation was taken from all the groups. The standard deviation for the temperature ranged from 0, from a group that recorded the same temperature from the spree, to 4.76 that came from a group that had a significant spike after the pre-walk phase of the experiment. The standard deviation in regards to the heart rate ranged from 4.12 to 30.04.
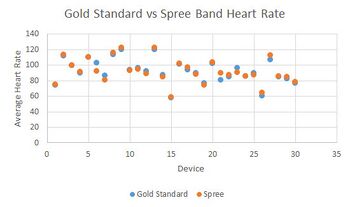
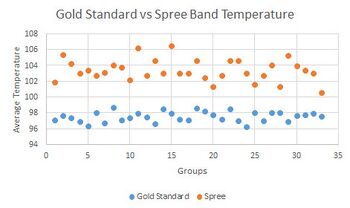
Then the Pearson's R value was found using the data of the Spree in comparison with the Gold Standard. The Pearson's R value for the Heart Rate was 0.971 while the Pearson's R value for Temperature was 0.076.
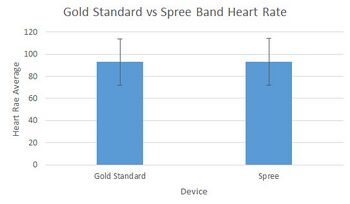
ResultsHere is the Bar graphs with the errors bars for the Heart Rate Average of all 33 groups, and the Scatter chart for calculating Pearson's R which was 0.971.
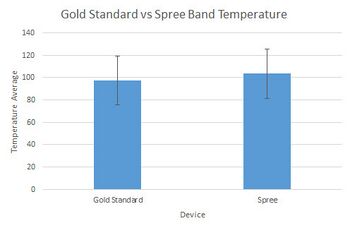
Here is the Bar graphs with the errors bars for the Temperature Average of all 33 groups, and the Scatter chart for calculating Pearson's R which was 0.076.
AnalysisThe Heart Rate results given by the Spree in comparison with the Gold Standard was relatively the same. This conclusion is supported with the finding of the Pearson's R value which is 0.97. Because this number is close to the desired value of 1.0, it is conclusive that the Spree device works in regards with measuring the Heart Rate and is accurate for the trials conducted. In contrast, the Temperature values were varied and inconclusive as supported by the Pearson's R value of 0.076. The acquired value is not close to the desired value of 1.0 and although accurate due to the percent error calculations, it demonstrates the fact that the Spree device is inaccurate in regards to measuring temperature. This difference can be attributed to the fact that the Spree device uses a different type of measurement to find the temperature. For example, the Spree machine categorizes the levels of temperature in levels starting from level 1 to level 4. Each level has a different range of temperature readings. Because measuring temperature through the skin is not very accurate, this method is used. This lab required the utilization of a paired t-test because different types of measurements were applied to the same subject. There was the Spree headband and the Gold Standard which were both used to measure body temperature and heart rate. After the data was recorded the difference between he two measurements(Spree and Gold Standard) were observed through the mean and standard deviation of the entire class' collected data. It is important to remove all extraneous data so that the variation is not too great or too small. The t-test helped determine whether the differences between the means of the two measurements were statistically significant or insignificant. In order for the significance to be determined a large sample size was needed which is why all groups' data were combined. If a sample is too small the accuracy of the two groups being statistically significant is far less than that of a large sample.
Summary/DiscussionDuring the experiment several flaws were apparent on the Spree device. It was difficult to get the Spree synced up with the iPhone because other Spree devices were interfering. Using blue-tooth technology would remedy the issue because a unique code would need to be entered into the iPhone and the connection would be made quicker. Another flaw is the compatibility to use with only iPhone devices. Spree would be more beneficial if it interfaced with other technologies like androids, windows phones, and tablets. The accuracy of the Spree was not great since the output was a number from 1 to 4 regarding body temperature. Specific temperature numbers like thermometers would be better instead of ranges that are tied to these 4 numbers. After the pre-walk phase of the experiment a walking or exercising phase started and in theory the body temperature should have gone up, but the location of the Spree was not optimal. With the Spree attached to the forehead of the individual the readings would not coincide with the gold standard since the body's natural reaction to cooling is by sweating which would affect the skin where the Spree was in direct contact with. Having a device that would be adaptable some way to take the core temperature orally, for example, and transmit it wirelessly would be more accurate than attached to the forehead.
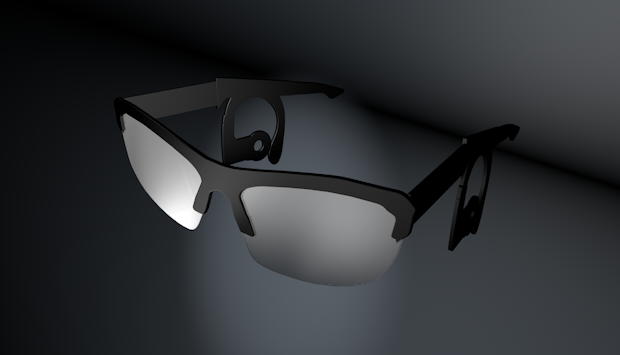
LAB 3B WRITE-UPTarget Population and NeedSpec, the latest biomedical device out in the market is revolutionary in the number of tasks it can perform as well as in the unique design in the area of physical activity and health. On the outside, Spec looks like a pair of sunglasses. But these sunglasses incorporate the innovative technology of Google eyewear to provide access to the measurements taken by the medical device in areas such as heart rate, temperature and glucose levels. The current technology out there such as the Spree Medical device does not stand up to the efficiency and uniqueness of the Spec in various categories. The main reason for Spec's greatness, can be attributed to more precise measurements as well as a variety of measurements. The Spec consists of two devices inter-connected through bluetooth. The first device in the wristband which has a couple buttons. Through this, the athlete can control his music playlist by pausing the song, or fast-forwarding to the next. In addition, this part of the device measures the heart rate using the central nerve of the wrist where the device is placed. This device then relays the information to the central device, the sunglasses. The sunglasses have earbuds interconnected with the side which can be placed in the ear to both listen to music and also an access way to measure temperature. The glucose levels are measured through small outlets near the nose which can collect the tears/sweat from physical exercise and calculate glucose measurements. These data recorded is then displayed on the interactive sunglass screen. The Spree, much like other medical devices, although able to display heart rate with fair accuracy, could not indicate the temperature levels and did not even have an option to measure other category such as glucose levels. This therein caused a need to design an instrumentation which can effectively target the growing population of those with diabetes and those athletes who just want basic data but would not be against receiving more information for about the same price. This therefore gives a much larger target population that characterized by the Spree. Diabetes is one of the top leading causes of death in many countries around the world including the United States. Nearly everyone should be maintain caution as not to become diabetic and should therefore take periodic measurements to maintain the correct standard. In addition heart rate and temperature, basic measurements are also included in this device. Having only to wear glasses rather than draw blood, the Spec eliminates drawn out procedures into a simple task of exercise which can give the same accurate measurement. The target population of this device includes athletes - beginners as well as professional - who are interested in monitoring their progress and being healthy. Any age, any height, any weight, are welcome to use the machine as long as they input their information pre-hand into the registration of this product which using the respective age, height, weight, time of day and physical activity, could give accurate results for those items being tested.
Device DesignThe design of our device consists of google glass to show the glucose measurements, temperature, heart rate and more. The glucose is measured in the nose bridge area where the sweat will be collected and measured. The temperature will be measured with the earphones for internal measurements as well as entertainment through music. The heart rate will be measured by the wrist band that is connected through wifi to the sunglasses and to the users phone.
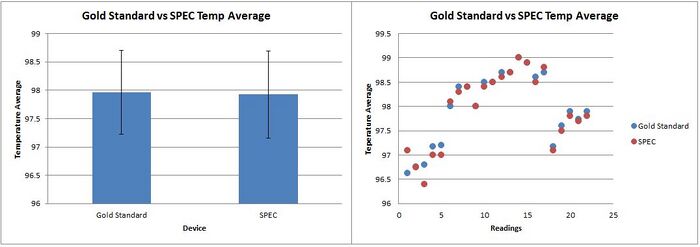
Inferential StatisticsThe final averages of the SPEC and the gold standard were calculated with the data from all the readings. The calculations included the 5 pre-walk readings, the 12 walking or exercise readings, and the 5 cool down readings. The tables below show the averages of the temperature, heart rate, blood glucose levels from the SPEC and the gold standard.
To measure the variability of the experiment the standard deviation was taken from all the groups involved. The standard deviation for the temperature ranged from 0 to .741. The standard deviation in regards to the heart rate ranged from 3.67 to 11.92. The standard deviation in regards to the blood glucose ranged from 9.52 to 15.72.
Then the Pearson's R value was found using the data of the SPEC in comparison with the Gold Standard. The Pearson's R value for the Heart Rate was 0.997. The Pearson's R value for Temperature was 0.979 and The Pearson's R value for Blood Glucose was 0.999. With the Pearson's value close to 1 indicates that the SPEC is a very reliable body monitor.
GraphHere is the Bar graphs with the errors bars for the Heart Rate Average, and the Scatter chart for calculating Pearson's R which was 0.997.
|
||||||||||||||||||||||||||||||||||||||||||||||||||||||||||||||||||||||||

