BME100 f2014:Group33 L3
| Home People Lab Write-Up 1 | Lab Write-Up 2 | Lab Write-Up 3 Lab Write-Up 4 | Lab Write-Up 5 | Lab Write-Up 6 Course Logistics For Instructors Photos Wiki Editing Help | |||||||
|
OUR TEAM
LAB 3A WRITE-UPDescriptive StatisticsGraph showing the Descriptive Statistics of the Temperature. Gold Standard vs. Spree
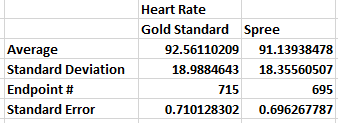
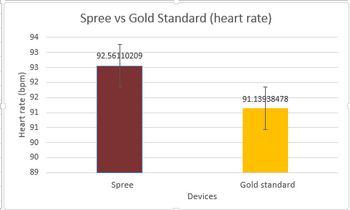
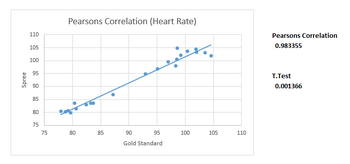
Graph showing the Descriptive Statistics of the Heart Rate. Gold Standard vs. Spree
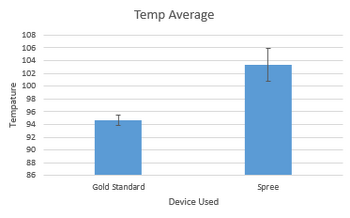
ResultsBar Graph comparing average Temperature as well as Standard Deviation. Gold Standard vs. Spree
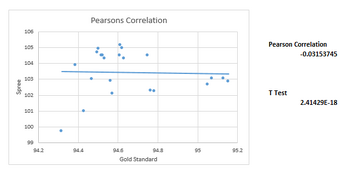
AnalysisScatter Plot of Pearson's Correlation of Temperature with T.test Scatter Plot of Pearson's Correlation of Heart Rate with T.test
Summary/DiscussionOne of the design flaws of the Spree device was that the signal would cut out, if the Spree band was too far away from the phone that the app was installed on. In order to enhance the signal strength of the spree device, an amplifier that was wireless could be attached to the spree device to boost the signal so it could accommodate a higher range, if the person wearing the device were to move farther away. After plotting the data for the heart rate and temperature of the gold standard and the spree band; the Pearson's Correlation for the heart rate shows a positive linear relationship while the graph for temperature shows no linear relationship between the Spree and Gold Standard. The Pearson's Correlation for the heart rate is not perfect, but it is almost positive one at 0.983355. A recommendation to enhance the accuracy of the temperature would be to measure the temperature internally instead of externally. This could be done by converting an ear thermometer to the size of a miniature headphone that could be attached to the spree band and just sit in the ear and automatically record the internal body temperature of a person at set intervals, which would not get in the way of the workout and would also allow the other ear to remain free to be able to hear others or listen to music.
LAB 3B WRITE-UPTarget Population and NeedThe target population includes all consumers of alcohol. The product is mostly geared towards people that are over the age of twenty-one and have the legal right to drink, but it is not limited to them alone. Dos Eyequis were invented in order to optimize the safety of the user and others that are around them to reduce the number of alcohol related accidents.
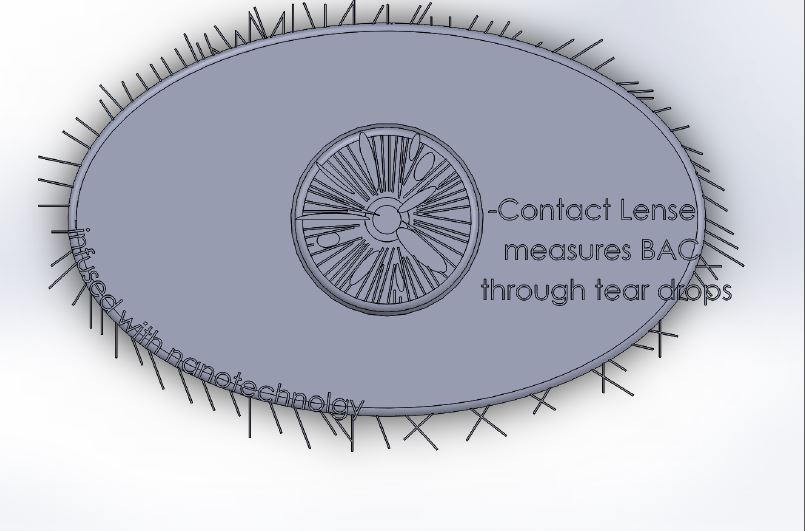
Device DesignThe device will be a pair of contact lenses that have nanotechnology installed in order to perform the functions advertised. The nanotechnology will have the ability to test the blood alcohol content (BAC) of the wearer by taking samples of tears, and then relaying the information back to a smartphone application. The app will then analyze the BAC and determine whether or not the user is over the limit of intoxication; if so, the program will alert the contacts of the wearer that were initially programmed into the application, allowing one of them to track him/her down and pick them up.
Diagram of the Device
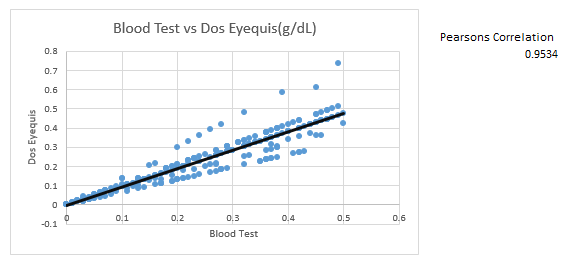
Inferential Statistics
Graph
|
|||||||


