BME100 f2014:Group32 L3
| Home People Lab Write-Up 1 | Lab Write-Up 2 | Lab Write-Up 3 Lab Write-Up 4 | Lab Write-Up 5 | Lab Write-Up 6 Course Logistics For Instructors Photos Wiki Editing Help | |||||||
|
OUR TEAM
LAB 3A WRITE-UPDescriptive StatisticsTemperature Data
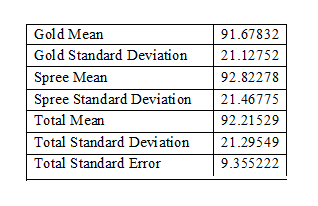
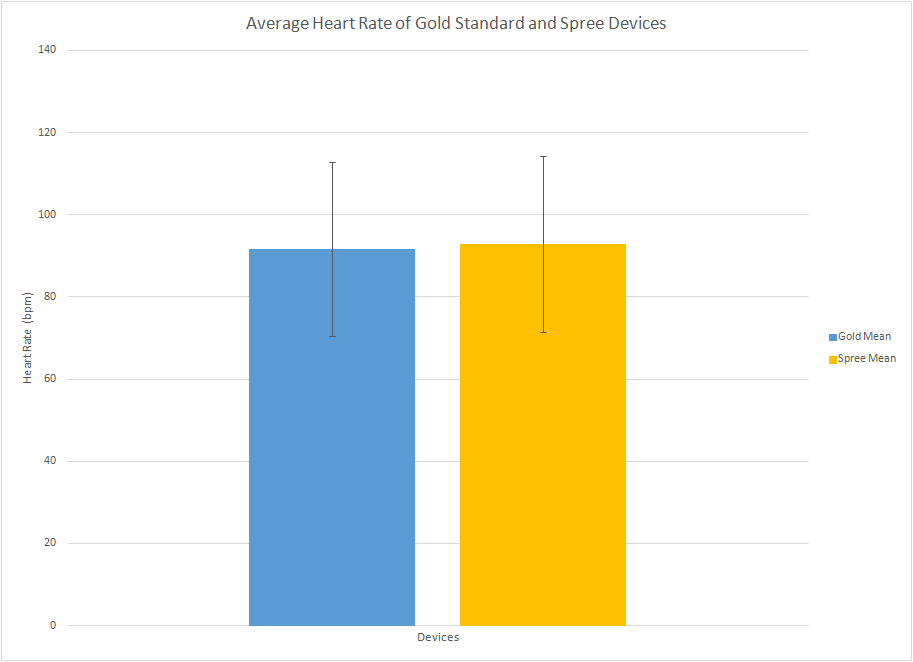
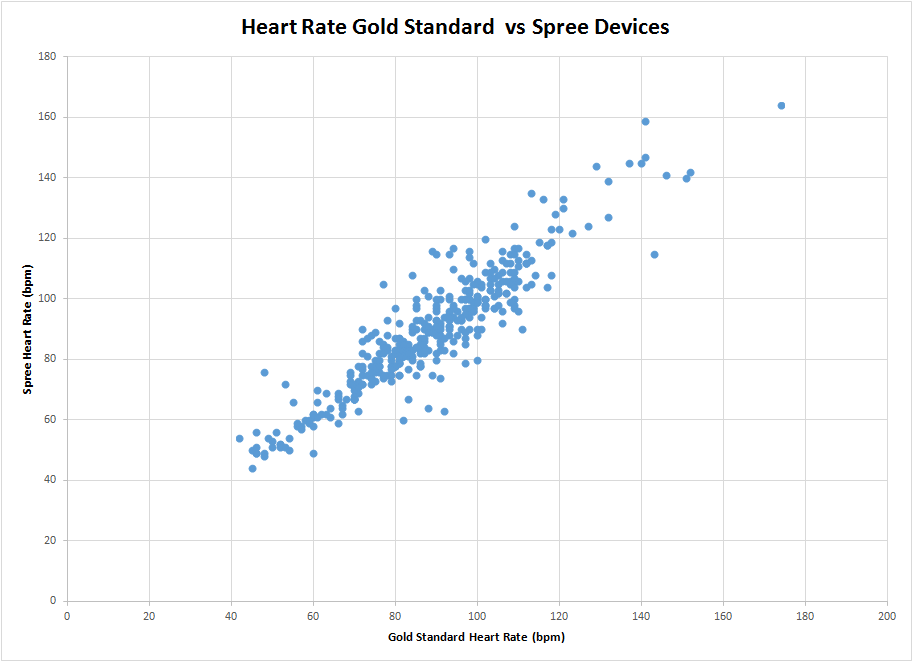
ResultsResults on Temperature: Results on Heart Rate: The mean of all the gold heart rate values was calculated to be 91.67832, the gold heart values have a standard deviation of 21.12752 and a standard error of 0.790124. As for the mean value of the spree value it was calculated to be 92.82278, the spree value had a standard deviation of 21.46775 and a standard error of 0.814318. The total combined mean for both spree and gold standard data was 92.21529 resulting in a combined standard deviation of 21.29549 and a total standard error of 0.567124. The Pearson's r-value for the gold standard data was 0.897446 and the t-test value was 0.325314. The presented calculated results above shows a strong relationship between both spree heart rate values and gold standard heart rate values, for example, the mean of the gold standard data values was 91.7 and the mean for spree values was 92.2, they are relatively close to each other. The difference between standard error of the readings was about 0.01 which is fairly low giving the Pearson's r-value a value of 1, which indicates strong linear correlation, thus when the gold standard heart rate values increase, spree heart rate values increase as well to a relatively close amount. At last, the t-test value showed how close the values were to each other.
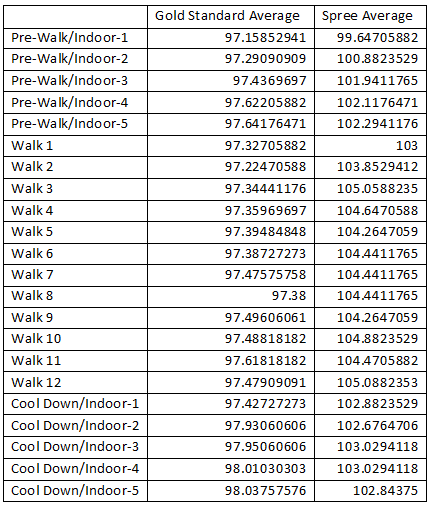
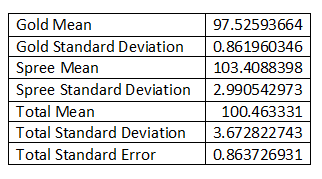
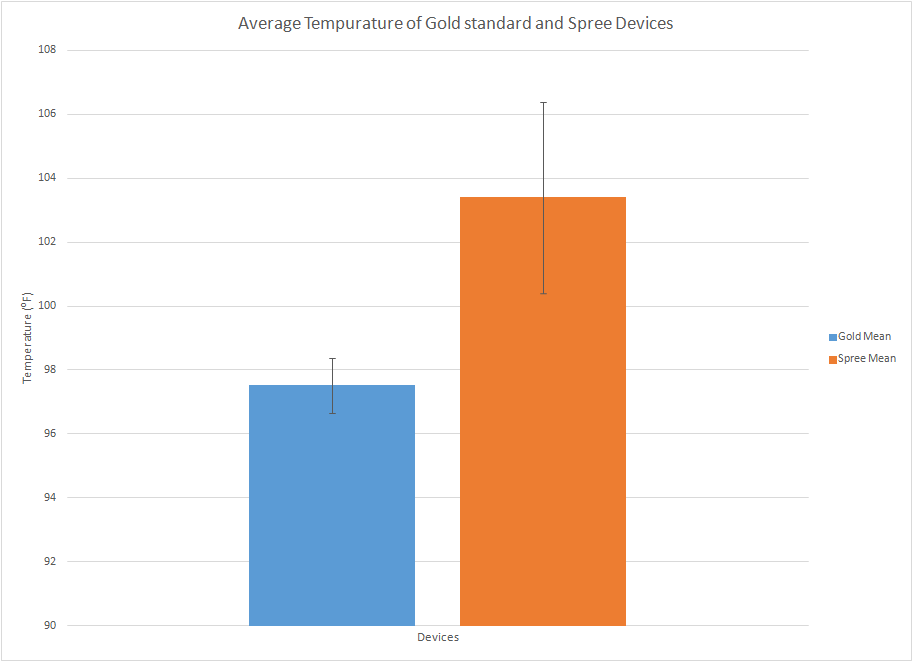
AnalysisTemperature Temperature was measured by using two different devices, the spree device and a gold standard thermometer. After doing the experiment the standard deviation for the spree device was recorded at 2.990542973; the thermometer was recorded at 0.861960346 and the total standard deviation was 3.672822743. By using these data values, a T-test was performed for these devices and a p-value was recorded at 8.3911E-259, which is much less than 0.05, which leads to the conclusion that the spree device is not accurate in recording temperature. The Pearson's r-value for these devices was calculated and was recorded at -0.016973185, which creates a negative correlation not close to one, which, if close to one, would validate the device's reliability in accurate temperature measurement. By analyzing the data it can be concluded that the spree device was not accurate because the p-value for this device was less than 0.05 and the Pearson's r-value was not close to 1. Heart Rate Using a pulse oximeter as the gold standard and the Spree device, heart rate was monitored throughout the experiment as the test subject performed light exercise. The results indicated that the Spree sensor did a fine job recording accurate heart rate of the subject. With a golden standard deviation of 21.12752 and a Spree standard deviation of 21.46775, results between the two did not vary by much. Upon utilization of the Pearson's r test, where -1, 0 and 1 represent correlation between data sets, an r-value of 0.90 was ultimately reached. An r-value of 0.90 suggests a positive correlation between the data, which solidifies the conclusion that the Spree device accurately measures heart rate.
Summary/DiscussionThe actual distribution of the data was skewed a lot but there seemed to be several similarities in the validity and reliability of the different technologies when compared to the gold standard. The T-test and the Pearson's R indicated a close relationship between the Spree band technology and the gold standard heart rate measuring technology. The spree technology, however, for the temperature recording was not up to the same definition. The temperature recordings were extremely biased because the spree technology did not produce a range of values to compare to the gold standard value. The Pearson's R for the temperature was close enough to 0 to show that there was almost no correlation between the gold standard and the actual measurement. The uncertainty in the data could be attributed to several different forms of error that propagated in the experiment. Spree technology only measures the temperature on the skin of the forehead while thermometers measure the internal core body temperature. Thus, the thermometer is more accurate in the definition of its measurements as compared to Spree band technology. The Spree as well transmitted the data through Bluetooth signaling and in the experiment during the app to spree syncing phase there were troubles and disconnections between the Spree band technology and the iPhone mobile application. During the experiment several different paces of walking and sitting were done, and heart rates and temperatures fluctuated wildly. However, the Spree band, especially for temperature, has an extremely low definition of the data that it outputs. The Spree only outputs 4 different values for the temperature which correlate loosely with the actual core body temperature which can be measured with the large range of temperatures that the thermometer gives. Different groups measuring with the Spree as well might cause fluctuations in the data because people have fundamentally different body temperature and heart rate fluctuations causing large amounts of deviation and standard error in some cases. Data that was not included in the heart rate and temperature and blanked out, marked as N/A, and marked as null needed to be ignored, as well as unique measurements of heart rate labeled with the values "1,2,3,4". Had this experiment needed to be done again, in order to improve it first one would need to isolate the Spree band technology from one another to prevent Bluetooth signaling interference between several spree bands. There needs to be a set pace of walking, perhaps matched to a beat, in order to steadily increase and compare heart rate measurements across groups. Similar people of similar body stature, size, and athleticism need to be used in the experiment in order to reduce extraneous variables contributing to error factors. And a more detailed temperature correlation system needs to be used for the Spree band technology in order to show a range of values rather than just 4 different values for temperature.
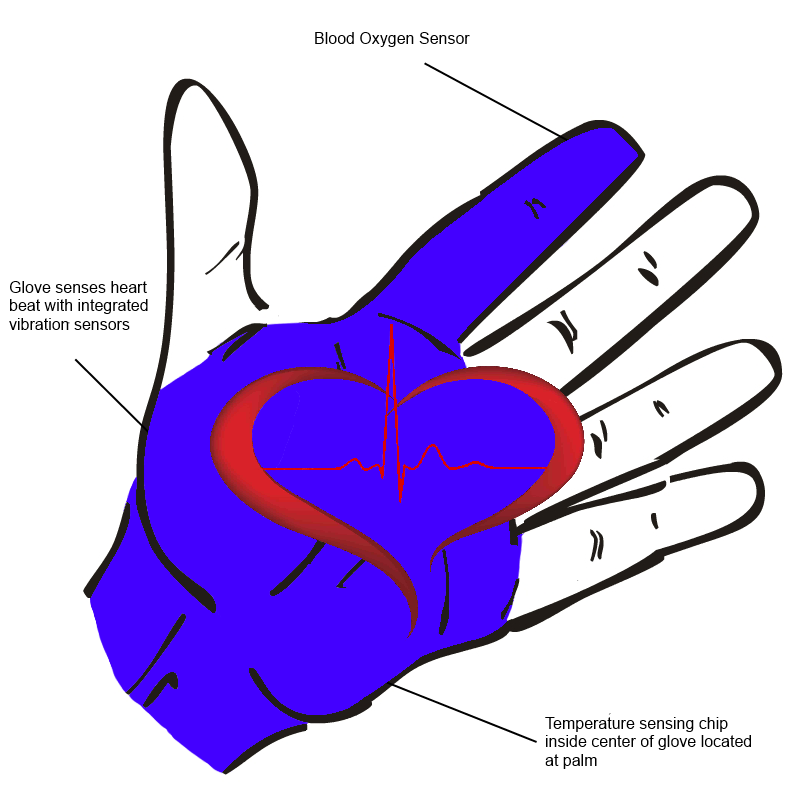
LAB 3B WRITE-UPTarget Population and NeedThe Vital Glove is intended to affect individuals performing any sort of athletic activity and monitor vitals significant towards maintaining a healthy lifestyle. It measures oxygen levels within blood, body temperature, and heart rate. Oxygen levels are an important measurement as it provides energy to the body - if oxygen levels become too low, the athlete cannot perform at peak performance. Temperature measurement is an important indicator for the body as athletes are exposed to a risk of overheating. Monitoring heart rate is critical to the well-being of the athlete, as a lack of increasing heart rate suggests a risk of mortality, and a high heart rate is dangerous for the heart. It is essential for people who are in high stress situations to monitor their heart rate as they are at risk of heart attack.
The Vital Glove's purpose is for any person involved in athletic activity to monitor and modify his own activity by readings based on what the Vital Glove details. The Vital Glove's measurements tell a person whether or not they are performing balanced athletic activity and are getting the most out of their workouts. Based on the information about blood oxygen levels the athlete or person involved in activity can modify his or her routine to take longer and deeper breaths or used a more controlled breathing pattern. Based on the temperature level the person can tell whether or not to drink more water in the face of dehydration. Based on the heart rate an athlete can control his or her pace and get the best workout possible without being to strenuous or light on the body. Athletes usually do not get the most efficient workout, and those that are starting or have been involved in athletic activity do not not know where to begin and how to monitor their activity properly, thus the Vital Glove is a good tool for anyone involved in such activity.
Device DesignThe Vital Glove fits like a glove with the exception of four fingers as the glove only fits the index finger and wraps around the wrist. The simplicity of this design allows for the user to bend their hand freely without limitation and perform all activities as if the glove were not there. In addition to its simplicity the glove is machine washable and comes in a variety of colors while maintaining an inexpensive price tag. The glove is also made from a light weight material that allows for the hand and wrist to breathe during activities that promote perspiration during all seasons of the year. While the glove is made from a breathable, light weight material the design does not neglect the durability of the device - the glove comes with a standard lifetime warranty to verify the confidence behind the glove's endurance. The device is capable of displaying important vitals to the user via Bluetooth through any smartphone or tablet. The single finger protection of the device integrates smartly into your phone with a single touch of the home screen or the button.
Inferential StatisticsBlood Oxygen Level:
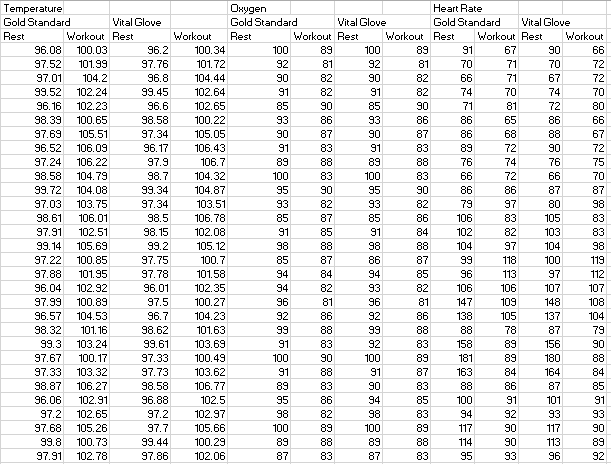
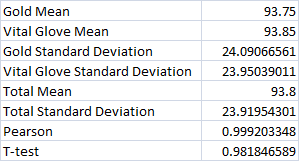
Heart Rate Heart rate is yet another vital measurement taken by the Vital Glove. To test the Vital Glove’s effectiveness, it was compared to the gold standard device for heart rate measurement. Multiple measurements were taken using both devices at intervals in which subject is both resting and exercising. These values were collected and a T-test was run to gather inferential statistics comparing the two devices. The resulting T-test obtained a value of .981846589, which is close to 1. This means that the data set values are highly comparative. Likewise, a Pearson’s r-value was obtained at .999203348, which again is very close to 1 and shows a strong correlation between the two products. According to this data, it is clear that the Vital Glove is highly effective in its measurement of heart rate and is similar in validity to the best gold standard devices. GraphTemperature
|
|||||||

