BME100 f2014:Group30 L2
| Home People Lab Write-Up 1 | Lab Write-Up 2 | Lab Write-Up 3 Lab Write-Up 4 | Lab Write-Up 5 | Lab Write-Up 6 Course Logistics For Instructors Photos Wiki Editing Help | |||||||
|
OUR TEAM
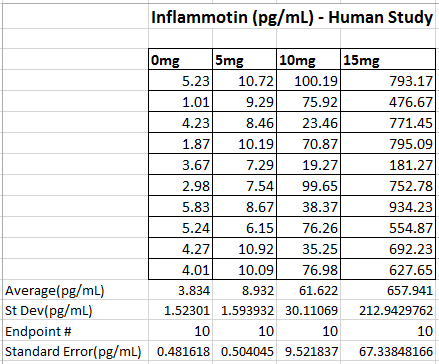
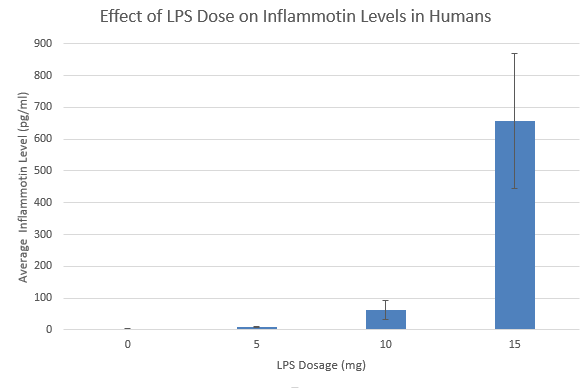
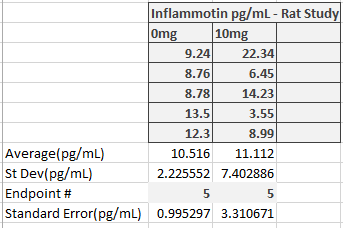
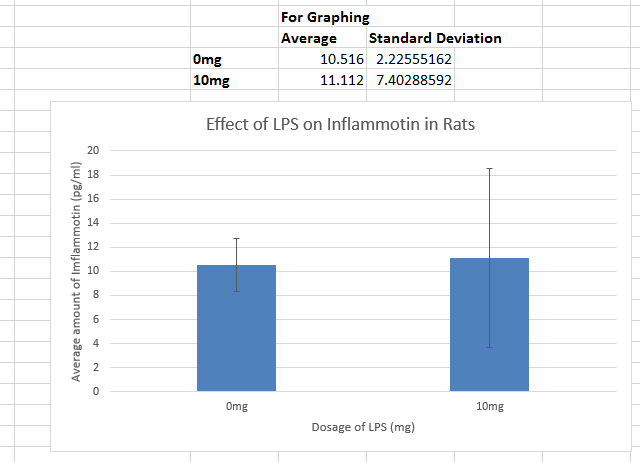
LAB 2 WRITE-UPDescriptive StatisticsExperiment 1 (Inflammotin Levels in Humans (pg/mL)) Experiment 2 (Inflammotin Levels in Rats (pg/mL))
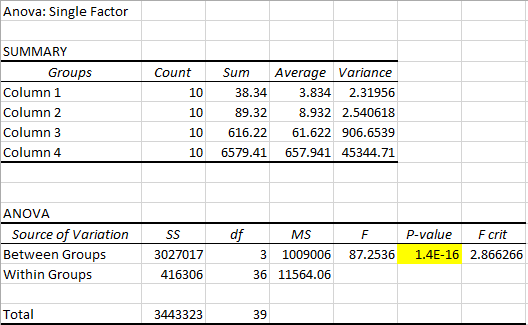
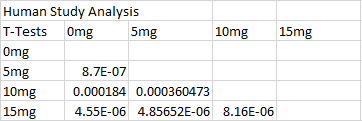
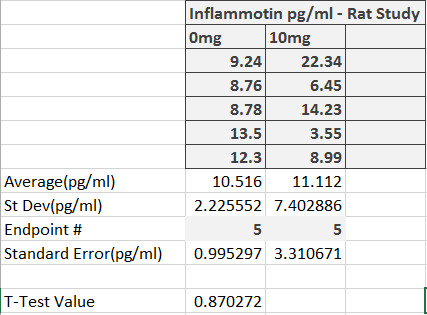
ResultsThis table reports the results from the ANOVA test that was performed on the experimental data for humans inflammotin levels of each dosage group. Based on the p-value that was calculated from the ANOVA test, the differences between inflammotin levels for each group were all statistically significant. The table above shows multiple T-tests that compare the results of two dosage groups at a time, which serves as a post-test for the ANOVA results. Since all of the p-values are less than .05, there are significant differences between all of the dosages, thus confirming that the results from the ANOVA test for the human experiment are valid. Experiment 2: Rat Test Results The value of the T-test for the rat experiment was 0.87, meaning there was not a significant difference between the inflammotin levels in each rat group. AnalysisExperiment 1 As a post-ANOVA test, the experimenters chose to perform multiple T-tests between the groups to find out which dosages had significantly different results. All of the T-test values were less than .05, which means all dosages have significantly different results. Experiment 2
Summary/DiscussionBased on the results, the lipopolysaccharide did not have a significant impact on the amount of inflammatin present in the rats. However, in the human trials, it showed a significant difference between all four groups in the amount of inflammatin in the blood. The P-value for the rats was .87, which displays that the values had no significant differences between the inflammatin produced after different doses because the P-value was not less than .05. For the humans, the P-value was 1.4*10^-16, which is incredibly less than .05. Based on this data, the human experiment had a significant difference in inflammatin produced between the doses, while the rat experiment did not. One of the reasons why the rat experiment did not show any statistically significant differences in inflammotin levels among the different groups could be due to the fact that there might not have been a sufficient difference between the amount of lipopolysaccharide administered to the rats for each group. In addition, there were only two rat groups, as opposed to the 4 dosage groups that were tested in the human experiment. If there were additional dosage groups to compare the 0mg and 10mg rat groups to, then there might have been statistically significant differences between higher dosage groups, as was shown in the differences between higher and lower dosage groups for the human experiment. In the case that one of these discrepancies in the data collection is true, the statistically insignificant results of the rat experiment might not be the best indicator to use as a prediction for the results of the human experiment. Though the two experiments used similar methods for affecting the same dependent variable with the same independent variable, there were differences in the number of dosage groups for each experiment, which may lead the experimenters to misinterpret the relationship between inflammotin levels and lipopolysaccharide dosages. |
|||||||

