BME100 f2014:Group2 L3
| Home People Lab Write-Up 1 | Lab Write-Up 2 | Lab Write-Up 3 Lab Write-Up 4 | Lab Write-Up 5 | Lab Write-Up 6 Course Logistics For Instructors Photos Wiki Editing Help | |||||||
|
OUR TEAM
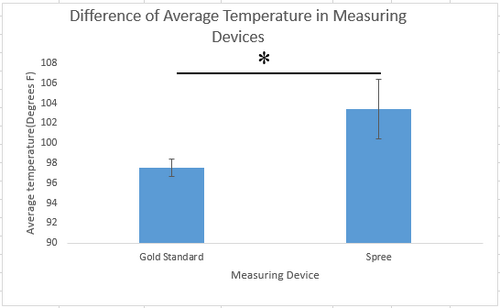
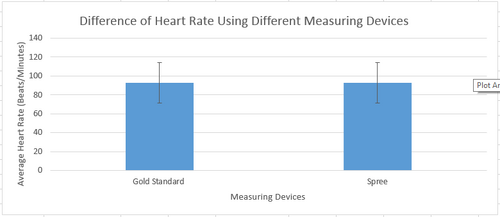
LAB 3A WRITE-UPDescriptive StatisticsResultsAnalysisTemperature: Heart Rate: Summary/DiscussionBased off the data collected when comparing the Spree headband to the gold standard of a blood pressure monitor and thermometer, the Spree headband does not work effectively. Although there was not a significant difference between the Spree blood pressure readings and that from the blood pressure monitor, there was a significant differences in the temperature readings from the Spree headband and the thermometer. This significant difference is a result of several design flaws in the headband; such as the inability to effectively secure the device to the user and the inability of the device to distinguish the temperature from the surroundings to that of the user.
LAB 3B WRITE-UPTarget Population and NeedThe target population of the fit pill is people interested in fitness and people interested in losing weight. This is the target population because the device monitors calories in and calories out, which will help people attempting to lose weight monitor their calories. The device also measures body fat percentage which aids people in the tracking of their fitness progress. The need is for a fitness based body monitoring device which does not interfere with the workout, unlike a headband or wristband. The need is also for an accurate device, and the fit pill provides a more accurate measurement since it the device measures within the body. Lastly, the need is for a user friendly app which tracks a person's fitness progress and provides the person with an easy to read report, which the fit pill does.
Device Design
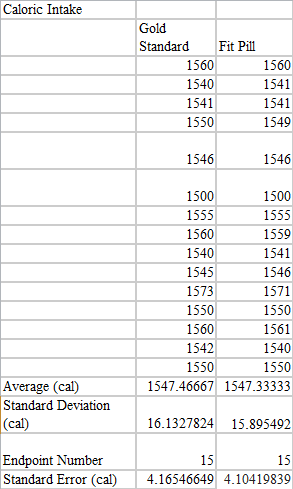
Inferential StatisticsCaloric Input Data Set Caloric Input Inferential Statistics
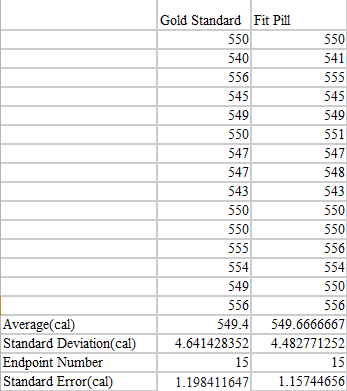
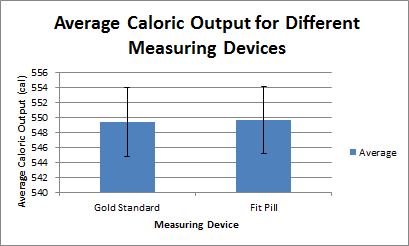
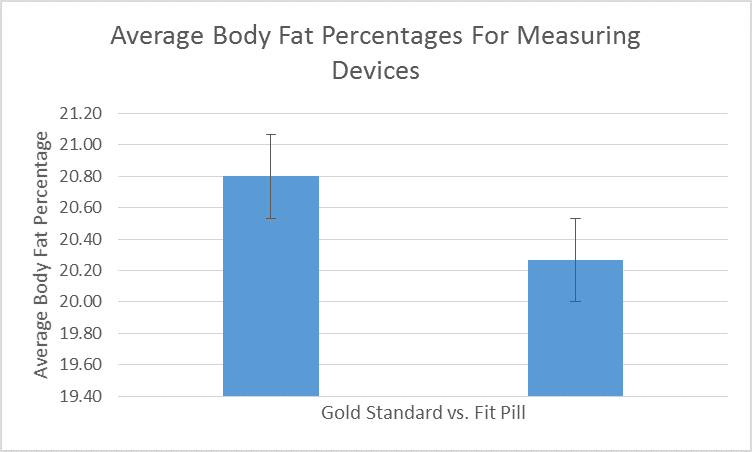
Caloric Output Inferential Statistics Body Fat Percentage Data Set Body Fat Percentage Inferential Statistics
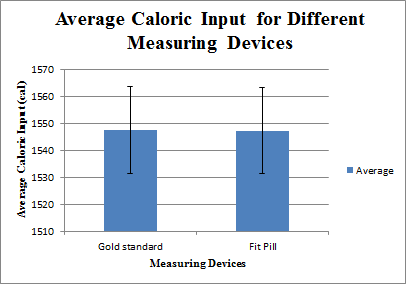
GraphCaloric Input Graph
|
|||||||


