BME100 f2014:Group28 L3
| Home People Lab Write-Up 1 | Lab Write-Up 2 | Lab Write-Up 3 Lab Write-Up 4 | Lab Write-Up 5 | Lab Write-Up 6 Course Logistics For Instructors Photos Wiki Editing Help | ||||||||||||||||||||||||||||||||||||||||||||||||||||||||||||||||||||||||||||||||||||||||||||||||||||||||||||||||||||||||||||||||||||||||||||||||||||||||||||||||||||||||||||||||||||||||||||||||||||||||||||||||||||||||||||||||||||||||||
|
OUR TEAM
LAB 3A WRITE-UPDescriptive Statistics
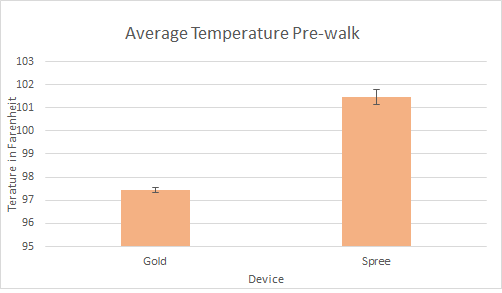
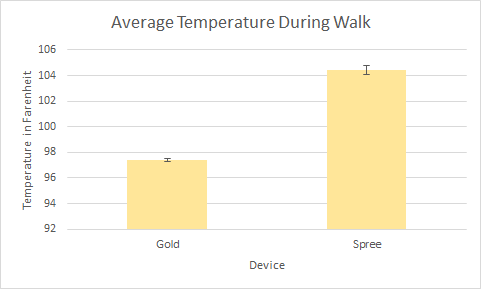
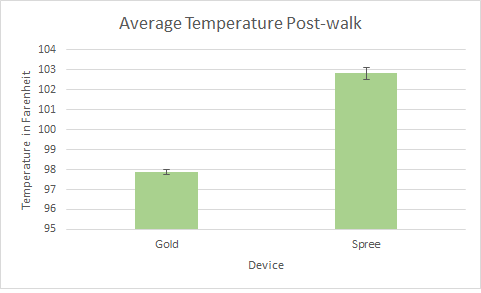
ResultsTemperature Data The results for our temperature data is as follows. We split up the data analysis into three different categories-"Pre", "Walk" and "Cool". We compared the results that the spree band gave to our gold standard measuring device. As you can see, the results, no matter the category show similar trends. The Spree band is not accurate in giving body temperature. Here is the data to support those claims. The average body temperature for the gold standard during the pre walk is recorded at 97.43°F while the spree band is shown at an average of 101.47 °F. The average gold standard values for the walk portion and cool down portion show very similar averages to the pre phase but the spree shows 104.43 °F during the walk and 102.83°F during cool down. Our T Test values confirm our suspicions about the credibility of the spree band: Pre phase has a T value of 2.7E-17, "Walk Phase" 1.35E-28, "Cool Phase" 3.2E-22 respectively. The pearson's R values for the data are 0.0108, 0.0758 and -0.15686 for "Pre" "Walk" and "Cool" Phases respectively. The data supports our suspicions that the Spree band is not a reliable devise to measure body temperature.
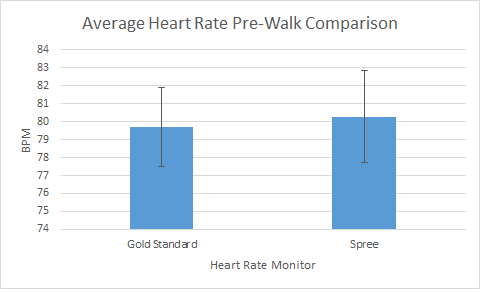
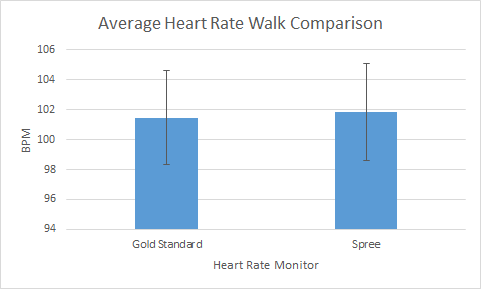
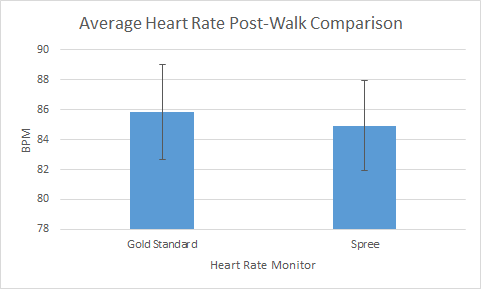
AnalysisFor the analysis in this lab we compiled all the data collected by each group and placed them in an excel sheet. To organize the data we separated the data collected into different time slot for example pre-walk column, walk column and lastly cool Down column. Once organized we took the averages of each groups data for each time slot for each group. Unfortunately due to user error some data was not able to b used and omitted from the analysis. Once averages were calculated we found standard deviation and standard error. We then preformed T-test for each time slots using the averages of the time slot to see if there were statistical differences between the spree device and the gold standard devices. Lastly taking the averages of the averages for the spree and gold standard devices for each time slot we created a bar graph for each time slot comparing the two devices.
Summary/DiscussionAfter analyzing our data, a conclusion can be made for both the Spree and gold standard measurements. T-tests of the averages for the heart rate monitor(gold standard) and Spree band were conducted to compare the two different monitors. The pre-walk t-test gave a 0.868 correlation, the walk t-test gave a 0.935 correlation, and the post-walk t-test gave a 0.838 correlation. These results do give us a positive correlation however, since they are less then .95 correlation, the product may not be as valid as the company says they are. T-tests of the averages for the thermometer(gold standard) and the Spree band were also conducted to compare the two systems. The t-test for the pre-walk gave a 2.7*10^-17 correlation, the walk t-test gave a 1.35*10^-28 correlation, and the post-walk t-test gave a 3.23*10^-22 correlation. Based on these results, it can be seen that the thermometer(gold standard) and the Spree band do not correlate at all and the Spree band does not give accurate results.
LAB 3B WRITE-UPTarget Population and NeedThe population that we are going to be targeting are mostly athletes as well as people who enjoy doing outside activities( hiking, beach, bicycling, etc.) . We are targeting these people specifically because our devices is going to measure the amount of UVA/UVB rays one takes in while they are outside. From this it is going to measure the percentage of the risk of developing skin cancer based on the amount of UV one is exposed to.
Device DesignDevise design will appear in a variety of forms. But for starters, the device will be a watch with features to track UVA/UVB radiation exposure. The device, for now, will be "athletic" in appearance so it will be used by users who love to be active in the sun. In later years, as the device gains traction with the general population, we will branch out and create partnerships with other watch brands. We will incorporate our technology into an already successful watch brand such as fossil of skagen. By doing this, our hope is to reach a wider audience, from all different walks of life.
Inferential Statistics
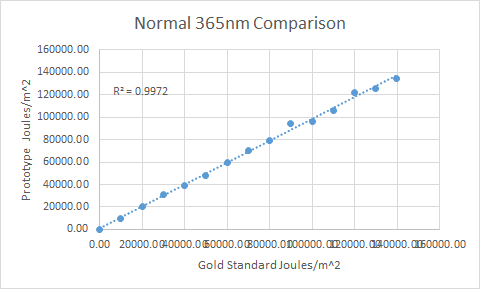
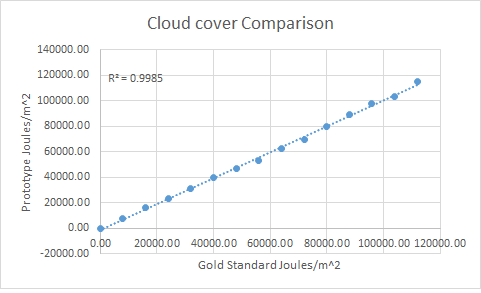
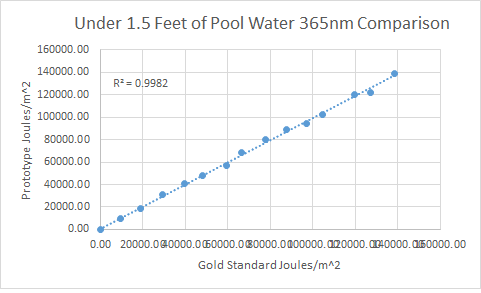
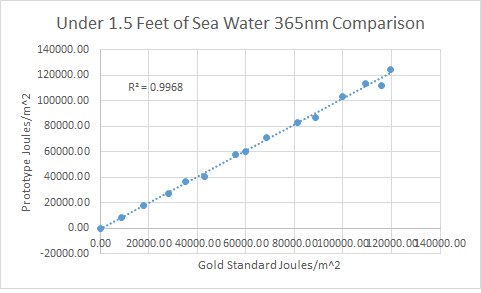
GraphNormal Conditions Cloud CoverUnder 1.5 Feet of Pool Water Under 1.5 Feet of Sea Water
|
||||||||||||||||||||||||||||||||||||||||||||||||||||||||||||||||||||||||||||||||||||||||||||||||||||||||||||||||||||||||||||||||||||||||||||||||||||||||||||||||||||||||||||||||||||||||||||||||||||||||||||||||||||||||||||||||||||||||||

