BME100 f2014:Group28 L2
| Home People Lab Write-Up 1 | Lab Write-Up 2 | Lab Write-Up 3 Lab Write-Up 4 | Lab Write-Up 5 | Lab Write-Up 6 Course Logistics For Instructors Photos Wiki Editing Help | |||||||
|
OUR TEAM
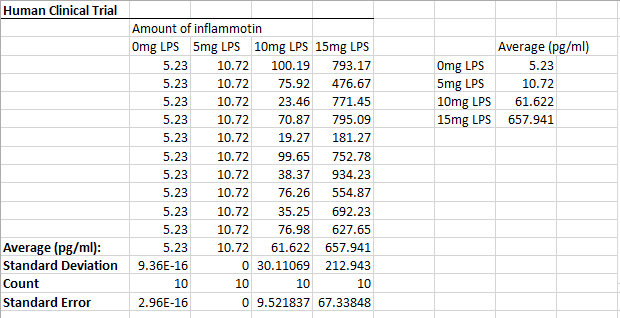
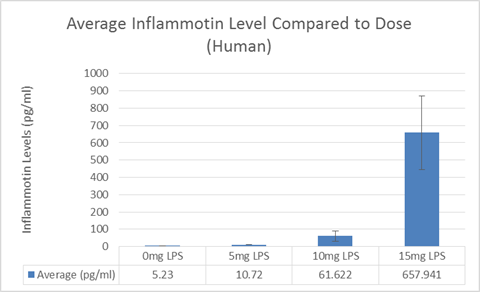
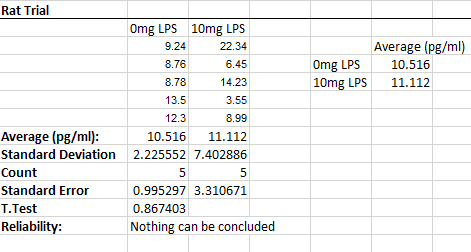
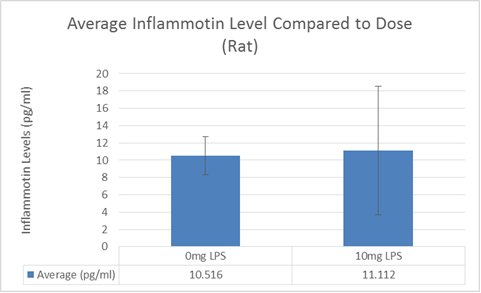
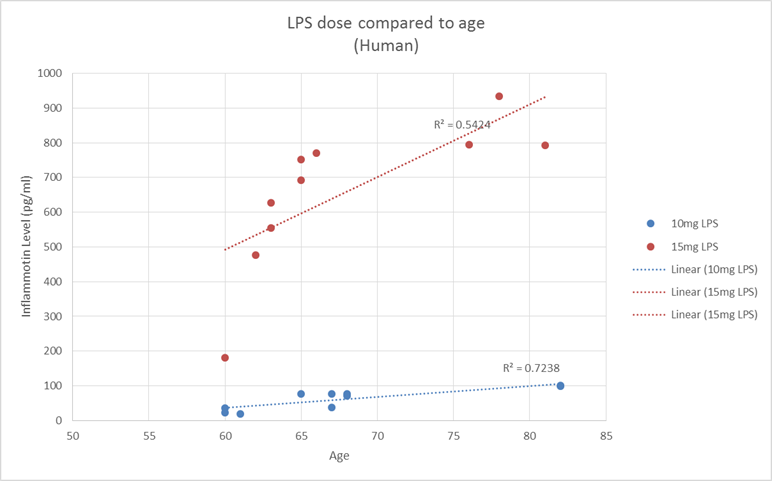
LAB 2 WRITE-UPDescriptive StatisticsExperiment 1 The mean for the human experiment was 5.23pg/ml for the 0mg LPS group, 10.72pg/ml for the 5mg LPS group, 61.622pg/ml for the 10mg LPS group, and 657.9pg/ml for the 15mg LPS group. The standard deviation for the human experiment was 9.4E-16 for the 0mg LPS group, 0 for the 5mg LPS group, 30.1 for the 10mg LPS group, and 212.9 for the 15mg LPS group. Experiment 2 The mean for the mouse experiment was 10.52pg/ml for the 0mg LPS group and 11.11pg/ml for the 10mg LPS. The standard deviation for the mouse experiment was 2.22 for the 0mg LPS group and 7.40 for the 10mg LPS. ResultsExperiment 1 After reviewing the produced data from the lab, there are some very interesting results. In experiment #1, our human trial, the amount of inflammation resulting from a certain dose of LPS was being tested. The subjects who received 0mg of LPS all produced the exact same value of 5.23 pg/ml. The data also shows a similar pattern for those who were given 5mg- a resulting level of 10.72gp/ml. The pattern showed in the first two sets drastically differed in terms of the 10mg dose and 15mg dose. The 10mg dose resulted with a range of 23.46-100.19pg/ml. The average value calculated from this set is 61.62pg/ml. The 15mg dose showed a drastic range as low as 181.27 and as high as 934.23pg/ml with an average value of 657.9pg/ml. Experiment 2
AnalysisExperiment 1 Experiment 2
Summary/Discussion
The previous is the excel file with all relevant data presented clearly. |
|||||||

