BME100 f2014:Group27 L3
| Home People Lab Write-Up 1 | Lab Write-Up 2 | Lab Write-Up 3 Lab Write-Up 4 | Lab Write-Up 5 | Lab Write-Up 6 Course Logistics For Instructors Photos Wiki Editing Help | |||||||||||||||||||||||||||||||||||||||||||||||||
|
Lab Report 3A: Spree ValidationYou have just graduated with your BME degree and have been hired by a start up company called “Suntronic”. They are developing a new body temperature and heart rate monitor for smart phones and want to check out the competition. The latest such device is from Spree Sports (www.spreesports.com) and they claim the device can accurately measure body temperature and heart rate. Your assignment is to assess how valid the device is as well as to identify any design flaws by comparing the temperature and heart rate readings on the device to those of an oral thermometer and pulse oximeter. ResultsTemperaute 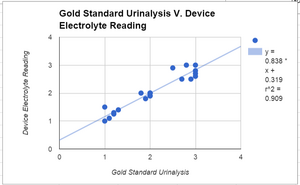

Statistical Evaluation and AnalysisT-Test for Temperature 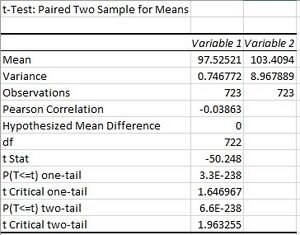
T-Test for Heart Rate 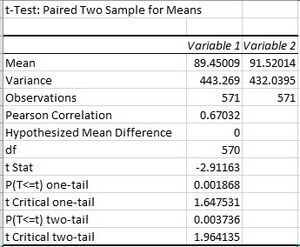
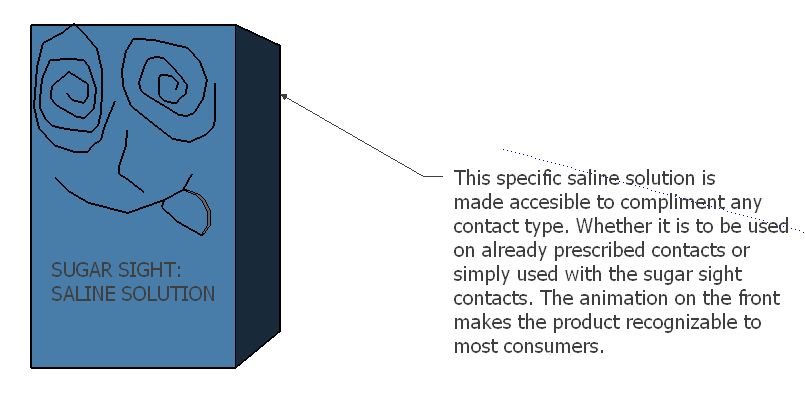
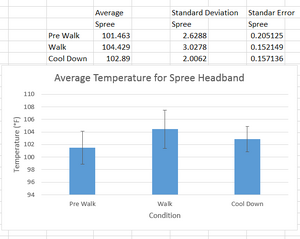
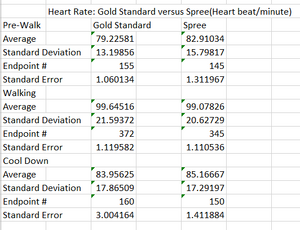
Inferential Statistics and Design Flaws with Recommendations Across this large sample size, we can infer that with the entire population that the Spree will not correlate with temperature and with heart rate as much as it should. Since there is virtually no correlation with temperature with the Pearson R, and the t-test shows that there is a difference between the two means, this shows that for the population the Spree is not a good indicator at all about the temperature of the user. Same goes with the heart rate. Even though Pearsons R has a relatively good positive Pearson R, the t-test still shows that the means are too far apart, and that we are confident there is a statistical difference between one mean and the other. Thus we can infer that amongst the population of Spree users, the temperature does not work at all when measuring actual body temperature, and that the heart rate is slightly accurate. However this temperature comparison may be flawed, as the Gold Standard measured internal body temperature which is always hotter, while the Spree measured external body temperature, which is always cooler. One way to fix this would be to use a thermometer that measures external body temperature next time when comparing the spree to a Gold Standard. The Spree app and headband was fairly well designed, but we found certain flaws especially with the physical design of the headband. Our test subject found that the sensor was too rigid, and after prolonged use hurt his forehead. Especially for use when working out, it should not hinder physical performance or require re-adjustment by the consumer. Additionally, we thought the headband should be made entirely waterproof and heatproof. It appeared to be water-resistant, but if the consumer is sweating profusely, it could possibly cause damage to the sensor. That way, it could also be used if someone wanted to wear it while swimming or if it was accidentally submersed in water. Taking into account the general purpose of the headband (for exercising), we also thought of other concerns that may arise in a gym setting. While walking with our test subject during the experiment, we noticed that we had to go very far from other sensors to be sure that we were picking up our own device. If the developers wanted the Spree app to be a widely used device, it may be a good idea to make it easier to name the devices or create a wireless connection other than Bluetooth. In a packed gym with many people in a close proximity (and all with Spree headbands), this could be a nuisance that may deter consumers from making a purchase. Additionally, the Bluetooth connection wasn’t very reliable; even when our subject was walking with the phone in his hand, it often disconnected (at times, every 3-4 minutes). This would be very inconvenient for someone working out; they may not realize it had disconnected until after they had finished their workout. The connection was especially unreliable if it was more than a foot or so away, which would be inconvenient especially for weightlifters who may have to leave their phone a few feet away. It also may be a good idea to run pressure tests on the headband (if the developers hadn’t done so already). If the headband was temporarily taken off and placed on a gym floor, it would be easy for it to be stepped on or for weights to be dropped on it, potentially ruining the device. Reinforcement precautions could help to prevent this kind of a situation. Lab Report 3B: SugarSight Development and Marketing Target PopulationThe target population for this device would be people that suffer from any type of diabetes. Because of their affliction they would obviously need to know when their blood glucose levels are critically low or high. A need for this would be prevalent among the diabetic community, because it would minimize the constant jabbing/pricking of fingers that a diabetic would experience when testing their blood glucose levels. With a pair of contacts that can turn different colors to indicate drops of spikes in blood glucose levels pricking fingers will be a thing of the past. The simplicity of wearing contact lenses will be revolutionary in that idea that any critical change in blood glucose level can noticed by simply being awake. DiagramPlans 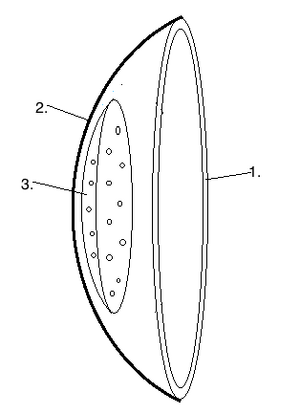 1. Silicone, oxygen permeable, soft lens for non-sight-corrective usage. Statistical Analysis
Table 5: Average and Standard Deviation of Blood Sugar Levels for Gold Standard and Sugar Sight 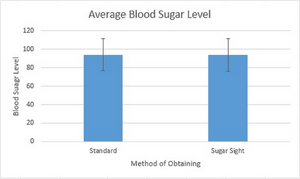 Inferential Statistics
Table 6: t-Test: Paired Two Sample for Means
ReferencesOn-line Sources |
|||||||||||||||||||||||||||||||||||||||||||||||||

