BME100 f2014:Group26 L5
| Home People Lab Write-Up 1 | Lab Write-Up 2 | Lab Write-Up 3 Lab Write-Up 4 | Lab Write-Up 5 | Lab Write-Up 6 Course Logistics For Instructors Photos Wiki Editing Help | |||||||||||||||||||||||||||||||||||
|
OUR TEAM
LAB 5 WRITE-UPProcedureCamera Settings
Calibration and Solutions Used Camera Set-Up
The iPhone 5S was placed on the cradle at a distance of 6.3 cm from the fluorimeter and positioned, so that the smartphone formed a 45 degree angle with the bottom of the cradle. In other words, the back of the smartphone rested on the side of the cradle closest to the fluorimeter. This ensured that the camera took focused pictures of the drops from the side.
Solutions Used for Calibration
BONUS - Photo of Fluorimeter Set-Up The picture above shows how the fluorimeter was set up. As described above, the iPhone 5S was placed on the cradle at a distance of 6.3 cm from the fluorimeter and positioned, so that the smartphone formed a 45 degree angle with the bottom of the cradle. In other words, the back of the smartphone rested on the side of the cradle closest to the fluorimeter. On the fluorimeter itself, slides holding drops consisting of SYBR Green I dye solution and the PCR product samples were placed to align with the fluorimeter's blue LED light. Bubble wrap and a plastic container were placed below the fluorimeter to raise it to a height at which the edge of the slides would align with the camera of the smartphone.
Placing Samples onto the Fluorimeter Calibration Samples
PCR Product Samples The procedure for placing the PCR product samples onto the fluorimeter is exactly the same as the one used above for the calibration samples, except for steps 3 and 10.
Data AnalysisRepresentative Images of Negative and Positive Samples
Data Tables for Calibration Samples
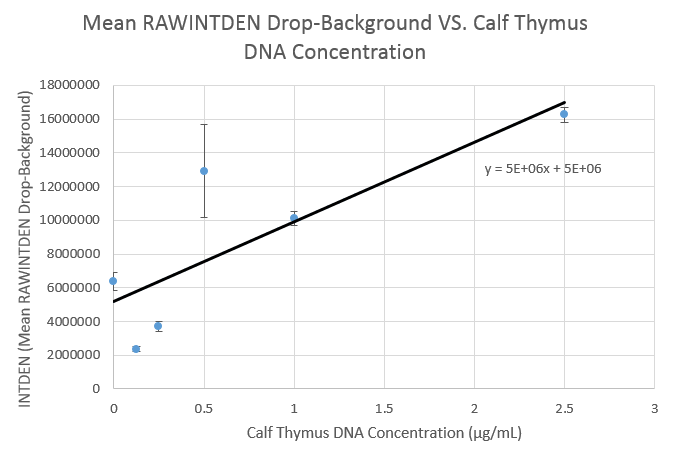
Calibration Curve
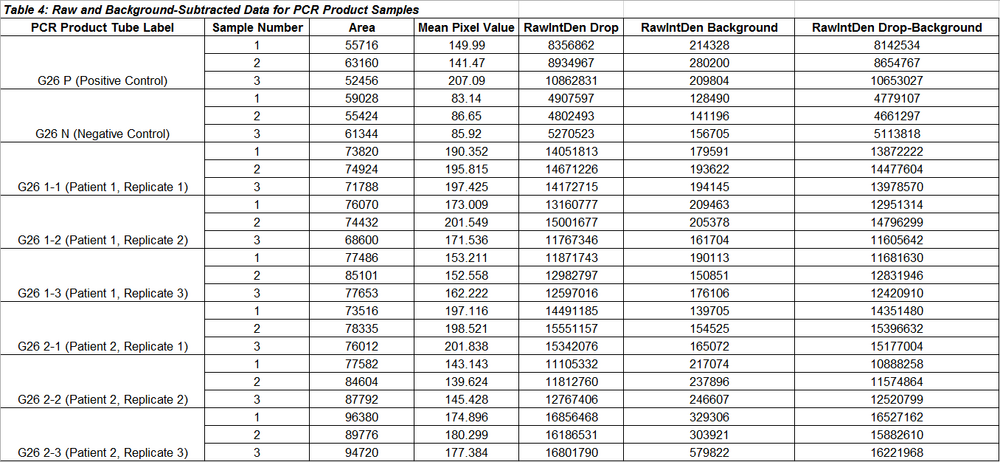
Data Tables for PCR Product Samples
PCR Results Summary
Observed Results
Conclusions
SNP Information and Primer DesignBackground A nucleotide is an organic building block of DNA and RNA, which is made up of a "backbone" of deoxyribose sugar (in DNA)/ribose sugar (in RNA) and a phosphate group, and one of the nitrogenous bases, adenine (A), thymine (T), cytosine (C), or guanine (G) [in DNA]/adenine (A), uracil (U), cytosine (C), or guanine (G) [in RNA]. A polymorphism is a variation in the DNA sequence that has no adverse effect on the individual carrying the variation. An SNP, which stands for a single-nucleotide polymorphism is a DNA sequence variation occurring regularly within a population, in which just one nucleotide - A, T, C, or G - in the genome is different between members of a specific biological species or set of paired chromosomes. The SNP specifically studied in this lab was the rs16991654 variation, which is found in the species Homo sapiens and located on chromosome 21:34370656. The rs16991654 variation holds clinical significance because it is pathogenic and is associated with the KCNE2 gene (potassium voltage-gated channel, Isk-related family, member 2), which regulates, among other things, the transport of potassium ions out of heart cells, which recharges the cardiac muscle after each heartbeat to maintain a regular rhythm. The sequence of the allele, which is an alternate form of the DNA sequence of a gene that results in different traits and is composed of one or more SNPs, associated with the rs16991654 variation contains a single SNP of TTC -> CTC. Although this SNP only involves one different nucleotide in the disease-associated allele, it is highly consequential, as it is linked to the pathogenesis of congenital Long QT syndrome (LQTS). LQTS is a rare, inherited heart rhythm disorder, which causes fast, chaotic heartbeats. These erratic heartbeats lead to an increased risk of sudden fainting or seizure and may even cause sudden death by prolonged irregularities in heartbeat.
Primer Design and Testing Non-Disease Primers
The result displays an output of a 220 DNA base pair sequence that contains nucleotides that lie in between the primer pair and includes the forward and reverse primers themselves. The chromosome indicated from the result is the chromosome on which the rs16991654 variation is found. As the primer test utilizes a non-disease human genome, it makes sense for the non-disease primers to work. Capitalization implies that the primer sequence matches the database sequence at that location; everywhere else, the sequence is lowercase. As displayed, the forward primer has a melting temperature of 56.5°C, and the reverse primer has a melting temperature of 60.0°C.
Disease-Specific Primers
When the disease-specific forward and reverse primers are inserted into the primer test, the results show that there are no matches. This is because the non-disease human genome used in the primer test does not contain the disease-associated allele (which has the variation of TTC -> CTC), which explains why the disease-specific primers do not work.
| |||||||||||||||||||||||||||||||||||


