BME100 f2014:Group25 L3
| Home People Lab Write-Up 1 | Lab Write-Up 2 | Lab Write-Up 3 Lab Write-Up 4 | Lab Write-Up 5 | Lab Write-Up 6 Course Logistics For Instructors Photos Wiki Editing Help | |||||||
|
OUR TEAM
LAB 3A WRITE-UP
Descriptive StatisticsPre-workout: Temperature: Workout: Temperature: Post-workout: Temperature:
Results
Inferential Statistics
The Pearson's r attempts to predict whether there is a linear correlation between two variables. Positive 1 indicates that there is a total positive correlation, 0 indicates that there is no correlation, negative indicates that there is a total negative correlation. The Pearson's R between the Oral Thermometer and the Spree Band during Pre-Workout, during Workout, and Post-Workout were all incredibly small values which were no where close to either positive one or negative one. The Pearson's R between the Pulse Ox and the Spree Band for the Pre-Workout, during Workout, and Post-Workout were on the other hand very close to positive one. This indicates that there is no correlation between the Oral Thermometer and the Spree Band and there is a positive correlation between the Pulse Ox and the Spree Band. The Student's T-Test and the Pearson's r agree with each other. Both the T-Test and the Pearson's r indicate that there is no relationship between the Oral Thermometer and the Spree Band, and that there is a relationship between the Pulse Ox and the Spree Band. These results demonstrate the efficacy of the Spree Band at measuring Heart Rate (as seen by Pulse Ox vs Spree Band), and that the Spree Band is not effective at measuring temperature (as seen by Oral Thermometer vs Spree Band).
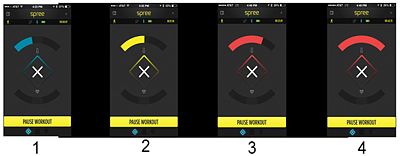
AnalysisIn this lab, the t-test was used because the approach that we took explored when and why the Spree was most effective -- if it was. By comparing the Spree and the Pulse ox/Gold Standard thermometer before the working, during the workout, and after the workout, we were able to identify that the Spree was accurate in measuring the user's heart rate, but not his/her temperature. While the Spree app was easy to download, the device was difficult to connect to the phone. Moreover, part of the problem with detecting the temperature of the user was that the device, phone, and sensor always had to be in close proximity to one another. Any spontaneous movements would be able to detect a difference in temperature -- but to what extent? Rather than actually measuring the temperature of the user, the Spree would use a color graded scale as shown below.
The calculated results of the standard deviation and standard error mimicked the data gathered from the inferential statistical analysis because the temperature sets possessed not only high variance, but also a large standard error when comparing the Spree values to those measured by the Gold Standard. In regards to statistical analyses, during the pre/during/and post workout trials, the T-Test p-value for the heart rate always showed no statistical significance in differences, inferring the measurements were accurate due to the lack of disparities. On the other hand, the measured temperature values displayed p-values so low that the data could not have overlapping or existing data points, concluding that the Spree device could not accurately measure heart rate, since the pulse ox had already been established as an accurate HR measurement device. Moreover, as seen by the results of the Pearson's R test, the heart rate trials consistently showed to have high correlation values -- values close to 1. Unlike those values of the temperature trials, whose Pearson's R values were meager, closer to zero, or in the positives. This measurement of ratios and proportionality further illustrates the accuracy of the Spree in its capability to measure heart rate, and it's lack thereof to measure temperature. Summary/DiscussionThe Spree headband was effective in measuring the heart rate, but not very effective in measuring the temperature of the participant. The p-value comparing the Spree heart rate values to the gold standard heart rate values, measured with a blood pressure cuff, is much larger than .05, showing that the data points between the two sets of data are similar. The p-value comparing the Spree temperature values to the gold standard temperature values, measured with an oral thermometer, on the other hand was extremely small, showing that the two groups of data were significantly different. Ideally, the device should provide similar values as ones' outputted by the gold standard, in which case the p-value would be high. The temperature mesurement had a low p-value, therefore that aspect of the Spree headband was not statistically significant; the heart rate value determined by the Spree headband was statistically significant as its p-value was near 0.5. The app relatively was easy to navigate, however was difficult to connect to the Spree Device. The app was not compatible with the iPhone 4, so minor patches in the coding could expand the possible users of the Spree headband. The rubber component of the spree headband was not comfortable, and it could possibly be more comfortable if it fit into a more headband type material like elastic and cloth. More vents in the rubber portion of the headband could improve the forehead's ability to breathe, leading to less discomfort in the region.
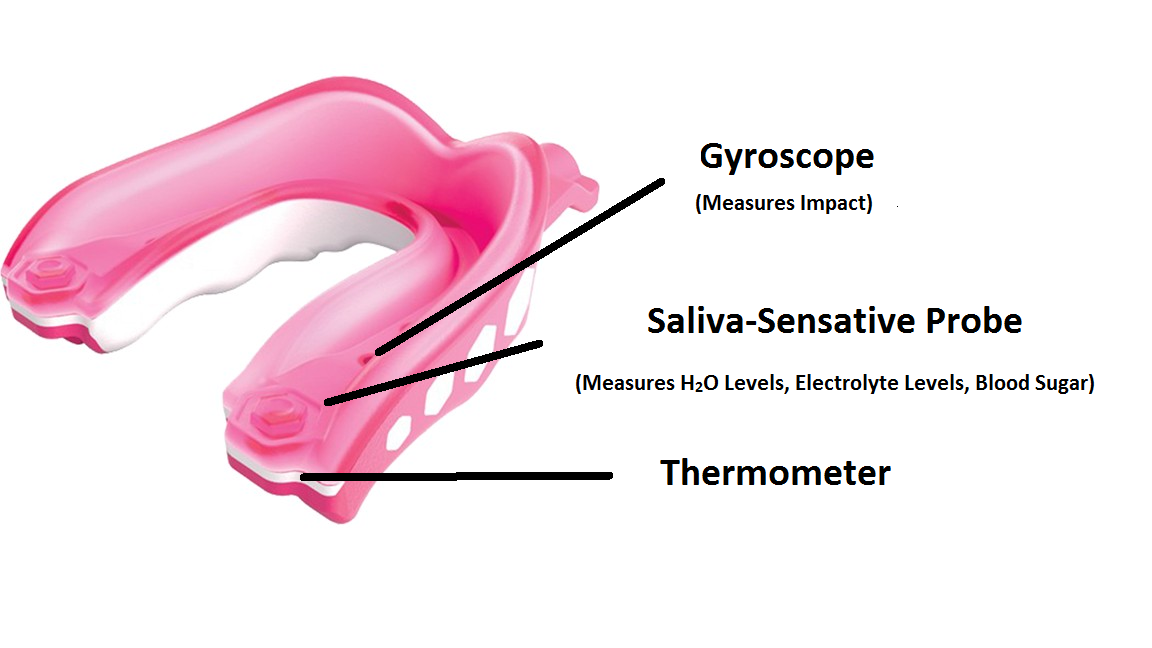
LAB 3B WRITE-UPTarget Population and NeedTarget Population Needs Device DesignThe Velociguard comes in a variety of possible colors to give the user the personalization he/she needs. It's main 3 components work harmoniously to monitor the different body measurements mentioned above. These values are then instantaneously transmitted to the smartphone application of one or multiple devices. The device has a long enough range to allow the athlete to be monitored from the sidelines and stands while he/she is in the game because the Velociguard allows them to STAY IN THE GAME. The gyroscope measures impact in Newtons on three axes.
The biosensors in the probe measure and eject electrolytes, sugar, and water when needed.
The mouth guard is malleable to fit the user's mouth more adequately.
The thermometer is used to measure the user's temperature.
ProcedureBlood Sugar Have a test subject insert the Velociguard into his/her mouth. Take 20 minutes to measure blood sugar levels with the Velociguard and a gold standard method for blood sugar measurement (finger prick blood measurement). Take a measurement every 4 minutes. Have the test subject perform vigorous athletics for 2 hours. Take blood sugar measurements form the Velociguard and the gold standard method every 10 minutes. Take another 20 minutes as a “cool down” period. Take blood sugar measurements every 20 minutes from both the Velociguard and the gold standard method. Repeat with a minimum of 9 more subjects. H2O Levels Have a test subject insert the Velociguard into his/her mouth. Take 20 minutes to measure H2O levels with the Velociguard and a gold standard method for H2O measurement. Take a measurement every 4 minutes. Have the test subject perform vigorous athletics for 2 hours. Take H2O measurements form the Velociguard and the gold standard method every 10 minutes. Take another 20 minutes as a “cool down” period. Take H2O measurements every 20 minutes from both the Velociguard and the gold standard method. Repeat with a minimum of 9 more subjects. Temperature Have a test subject insert the Velociguard into his/her mouth. Take 20 minutes to measure the subject’s temperature with the Velociguard and a gold standard method for temperature (mouth thermometer). Take a measurement every 4 minutes. Have the test subject perform vigorous athletics for 2 hours. Take temperature measurements form the Velociguard and the gold standard method every 10 minutes. Take another 20 minutes as a “cool down” period. Take temperature measurements every 20 minutes from both the Velociguard and the gold standard method. Repeat with a minimum of 9 more subjects. Electrolyte Levels Have a test subject insert the Velociguard into his/her mouth. Take 20 minutes to measure the subject’s electrolyte levels with the Velociguard and a gold standard method for electrolyte levels measurements. Take a measurement every 4 minutes. Have the test subject perform vigorous athletics for 2 hours. Take electrolyte levels measurements form the Velociguard and the gold standard method every 10 minutes. Take another 20 minutes as a “cool down” period. Take electrolyte levels measurements every 20 minutes from both the Velociguard and the gold standard method. Repeat with a minimum of 9 more subjects.
Place the Velociguard inside the mouth of a full body crash test mannequin. Have varying levels of impact forces applied to the mannequin (25 lbs, 50 lbs, 75 lbs, 100 lbs, 125, lbs, 150 lbs, 175 lbs, 200 lbs). Record the measured force by the Velociguard. Repeat each of these forces 5 times. *note: these forces should be applied to the head in order to test for risk of concussion by being compared with proven data for causation of a concussion. Inferential Statistics
Graph
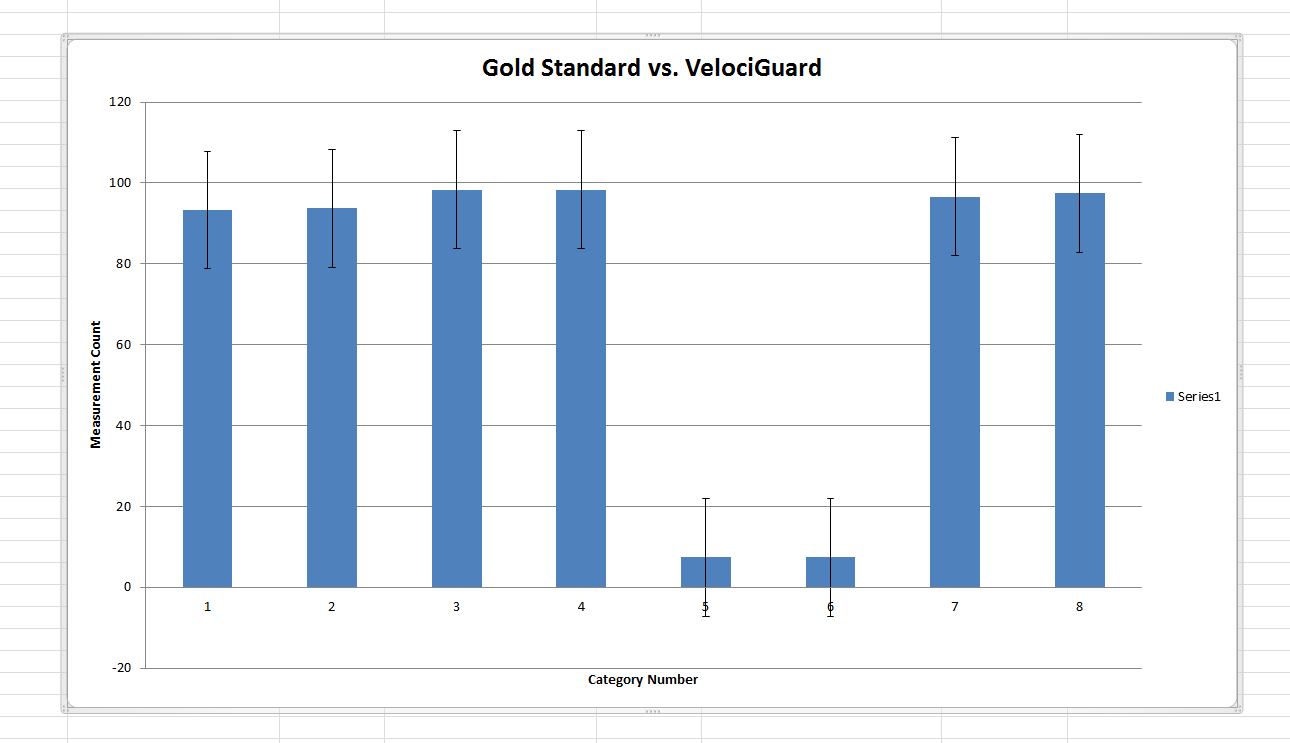
The overlapping error bars indicate the VelociGuard's measurement of blood sugar, hydration, electrolyte levels, and temperature is precise and accurate as compared to the gold standard measurement device for each category. |
|||||||


