BME100 f2014:Group24 L6
| Home People Lab Write-Up 1 | Lab Write-Up 2 | Lab Write-Up 3 Lab Write-Up 4 | Lab Write-Up 5 | Lab Write-Up 6 Course Logistics For Instructors Photos Wiki Editing Help | |||||||
Our TeamLab 6 Write-UpBayesian StatisticsOverview of the Original Diagnosis System The thirty-four teams in our lab, each consisting of six students, divided the work of diagnosing sixty-eight patients for the disease-associated SNP. Each team was given the DNA samples from two patients to analyze for the disease-associated SNP. In order to minimize error and ensure accurate results, each team tested three samples per patient and had a positive and negative control. In addition, each team followed a strict, uniform outline for procedures, promoting more accurate and parallel methodology. This included the procedures for operation of the PCR machine and the Image J analysis. For the Image J analysis portion of the lab, three images were used for each PCR sample. The entirety of the class’s data was then complied into a large spreadsheet to calculate the reliability of diagnosing the patients with this methodology.
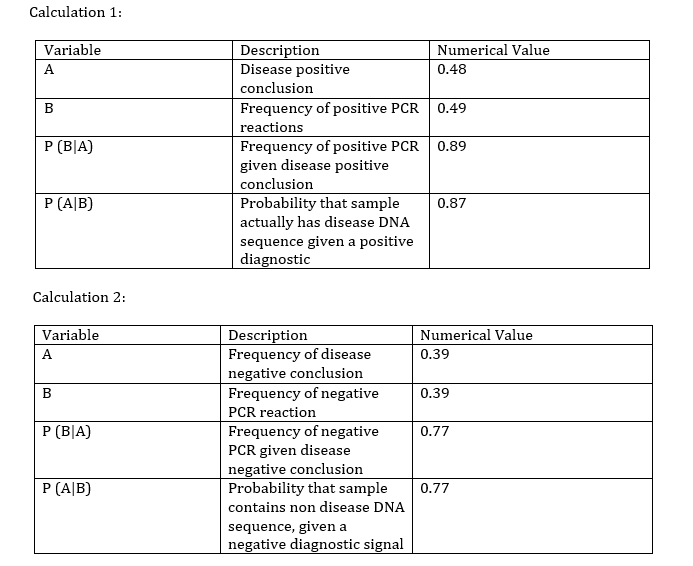
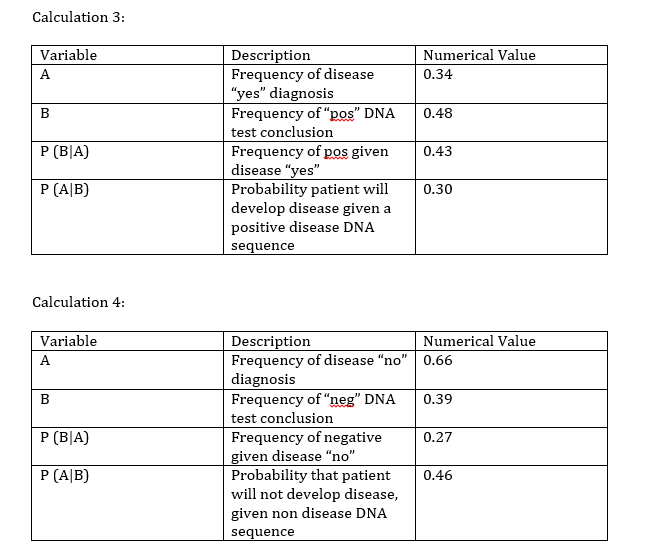
What Bayes Statistics Imply about This Diagnostic Approach The results for calculations one and two indicate that the PCR is a highly reliable tool for the detection of the disease SNP in the samples. The calculated Bayes values for one and two were respectively 0.87 and 0.77, both of which are close to 1.00 (100%). Even though the PCR shows great promise and high accuracy for the detection of already developed diseases, it falls short in the prediction of developing diseases. The calculated values for three and four are a lot closer to zero, with the values respectively being 0.30 and 0.46. There are a few possible sources of error that would account for the calculated Bayes values, most of which would be human error. Contamination would most likely account for the largest amount of error since it is very easy to contaminate a sample. A human contamination could cause the sample to replicate an incorrect DNA strand, thus yielding incorrect values. Mislabeling could also be a cause for error, however the chances of mislabeling are slim since the obtained Bayes values seem to be reasonably reliable and very close to 1.00 for one and two. Another source of error could be a defective or faulty PCR machine. The PCR machine could have had an incorrect threshold or baseline, this could cause the machine to slip and would result in skewed final results. Computer-Aided DesignTinkerCAD
|
|||||||


