BME100 f2014:Group23 L3
| Home People Lab Write-Up 1 | Lab Write-Up 2 | Lab Write-Up 3 Lab Write-Up 4 | Lab Write-Up 5 | Lab Write-Up 6 Course Logistics For Instructors Photos Wiki Editing Help | |||||||
|
OUR TEAM
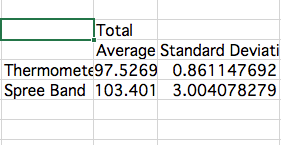
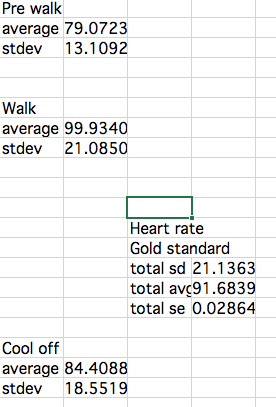
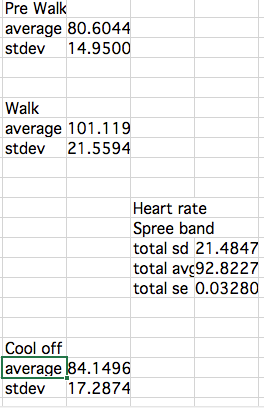
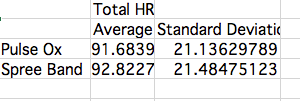
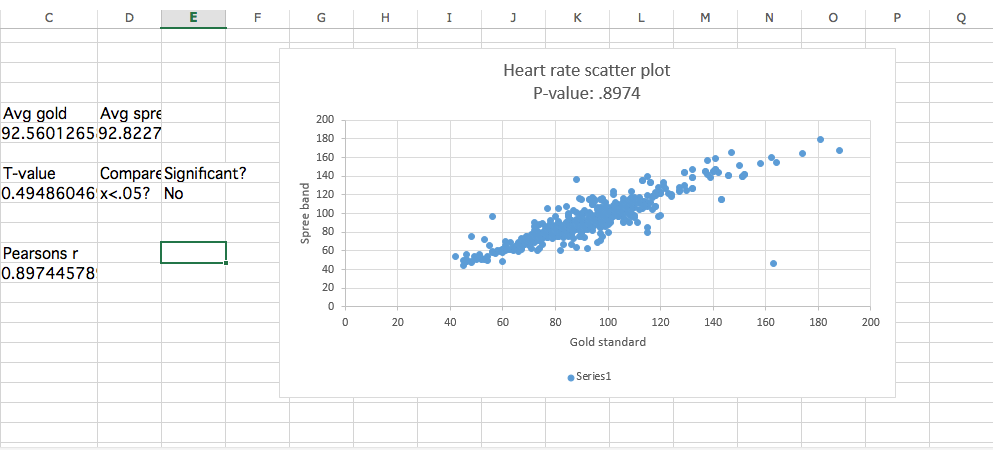
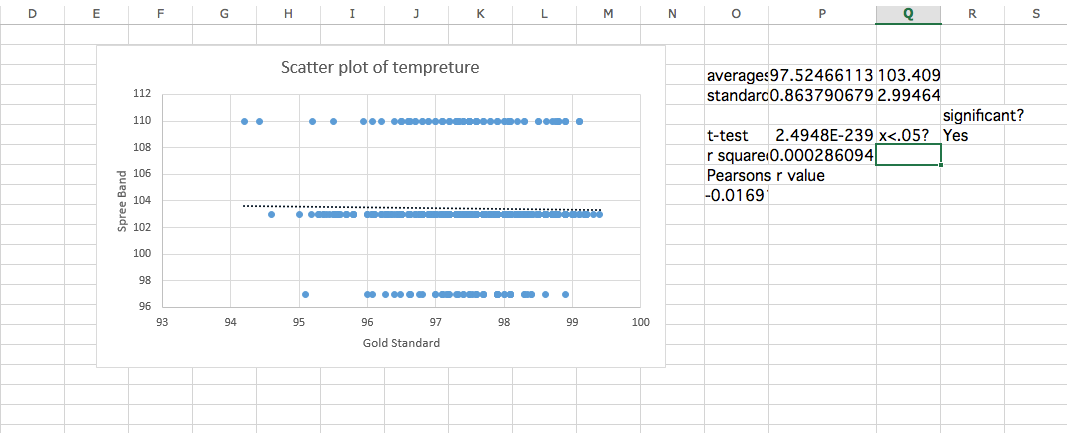
LAB 3A WRITE-UPDescriptive StatisticsThe mean for the temperatures taken with the thermometer, or gold standard device, was 97.527 degrees Fahrenheit. The standard deviation for the temperatures taken with the thermometer was 0.861 degrees Fahrenheit. The standard error for temperatures taken with the thermometer was 0.0011 degrees Fahrenheit. The mean for the temperatures taken with the spree band was 103.401 degrees Fahrenheit. The standard deviation for the temperatures taken with the spree band was 3.00 degrees Fahrenheit. The standard error for the temperatures taken with the spree band was 0.0040 degrees Fahrenheit. The mean for the heart rates taken with the pulse ox was 91.684 beat per minute. The standard deviation for the heart rates taken with the pulse ox was 21.136 beats per minute. The standard error for the heart rates taken with the pulse ox was 0.0286 beats per minute. The mean for the heart rates taken with the spree band was 92.823 beats per minute. The standard deviation for the heart rates taken with the spree band was 21.485 beats per minute. The standard error for the heart rates taken with the spree band was 0.0328 beats per minute. ResultsFor the Spree Band versus gold standard thermometer, the t-test was 2.4948E-239 and the r squared value was -0.01691432. For the Spree Band versus gold standard heart rate measurement, the t-test was 0.49486046 and the r squared value was 0.89744578.
AnalysisBy comparing the heart rate readings between the Gold Standard thermometer and the Spree band, a T-Test value of .494 was acquired. Since the P-value is higher than .05, the data can be deemed statistically significant, meaning that there is a correlation between the Spree Band and the Gold Standard. However the Pearson's R Value which was .897, which although close to a value of 1, is not the required .95 r-value required for an accurate medical device. The Spree Band is close to measuring an accurate heart beat, but not close enough to be considered completely accurate.. The Gold Standard and the Spree band data concerning temperature were also compared, revealing a T-Test value that was below the x=.05 significance standard, at 2.5 x 〖10〗^(-239). The Spree Band temperature readings can then be considered inaccurate, without any correlation whatsoever. This also agrees with the Pearson's R value of -.017. The small number suggests the inaccuracy of the device as well as the negative correlation, the opposite correlation than what its supposed to be. This device is not accurate in measuring core body temperature, and therefore not an accurate medical device in this area.
Summary/DiscussionThe biggest design flaw in the Spree Band was the temperature monitor. It gave a general reading of "high," "medium," and "normal," which are all broad and essentially useless. Along with that, according to the data, this part of the device was completely inaccurate. It is very difficult to monitor core temperature with the surface of the skin. However, the device could be improved by giving an actual estimation. The device could measure the temperature of the skin, and estimate based on that reading what the core temperature might be, and record that information. Since the device is pressed up against the skin and restricting air flow, it would tend to heat up that specific area of the skin, potentially causing a misread. If the device had a greater surface area to measure, with a different material to prevent sweating and allow for better air flow, it could get more accurate readings. Another flaw in the design was the occasional inaccurate readings in the heart rate sensor. In general, the device did manage to gain a close reading, but it tended to fluctuate suddenly. This could be due to movement, or the sensor itself in the headband that malfunctioned on occasion, causing errors in the reading. This could also be improved if the device was close to a larger primary artery, where it would be much easier to detect the heart rate. One last design flaw was the price, and although it uses new technology to supposedly read body temperature and heart rate accurately, it was nearly 300 dollars. It is an unfashionable headband that sticks out, is uncomfortable, and simply isn't worth such a high price. The device could be made much simpler by attaching to the forearm or upper arm, and the sensors would not have to be as expensive to take the same measurements. To give a comparison, the new apple watch costs near the same, yet has the same technology including a touch screen and is still fashionable.
LAB 3B WRITE-UPTarget Population and NeedVenomous bites and stings are a serious problem throughout the United States. The target population is people living in places where venomous species, such as rattlesnakes and scorpions are prevalent. These locations include states such as Arizona, California, New Mexico, and many other places throughout the U.S. Nearly 17,000 people in the United States are stung by scorpions each year, with about 8,000 people in the U.S being bitten by venomous snakes each year. Furthermore People who spend a lot of time outdoors, such as hikers, are at a higher risk of being stung or bitten by venomous species. A faster, more convenient way of giving antivenom is necessary. Another target population could be a form of aid to third world countries. Many of these places have many venomous species of snakes and scorpions as well, without hospital care as an option. In addition, children are at a huge risk with these venomous species, being more susceptible. The device could prevent deaths from bites in those locations as well. Also, the device is affordable enough to be widely distributed throughout high risk areas.
Device DesignThe Device was designed to be affordable as well as easy to use. It was primarily based on a Band-aid type of material, that allows the Venom-Aid patch to adhere to the skin, allowing for the best effect. The size was based on a simple oval shape, which at its longest was 1 and 3/4 inch and the width was 3/4 inch. It was designed to be large enough for snake bites, but also not so large as to be cumbersome if used on a smaller scorpion or spider bite. It also needed a decent surface area to be able to nullify the maximum amount of venom as possible, if it spread farther than the bite. It uses small micro-needles placed on the surface of the device to inject various types of anti-venom to attempt to counteract the negative effects of the venom, before they occur. The patch also manages to extract some of the venom at the location of the bite through through a form of capillary action. The main goal of the device is to make an affordable solution to venomous bites, and prevent the need for hospital treatment. It is simple, effective, and could be used to potentially save lives.
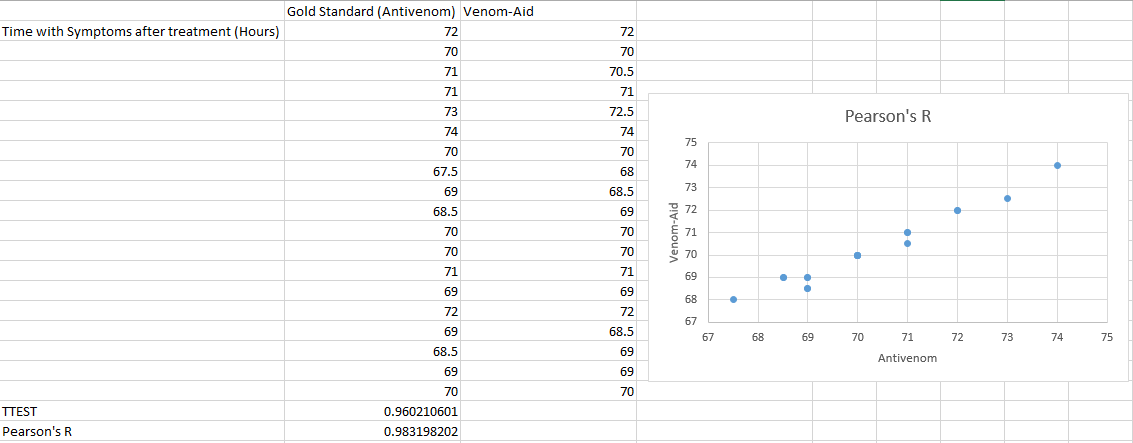
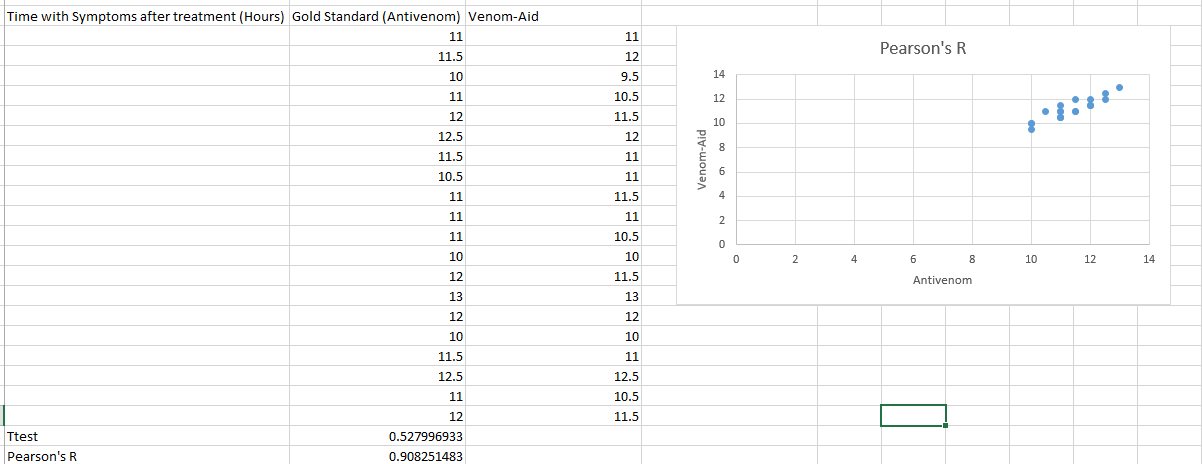
Inferential StatisticsTwo data sets were collected for people bitten by rattlesnakes. One data set includes the length of symptoms after treatment for 19 subjects given the gold standard, or antivenom, after a snake bite. The other data set includes the length of symptoms after treatment for 19 subjects given Venom-Aid. The t-test value from the two data sets was 0.9602, showing that there is no statistical difference between the antivenom and Venom-Aid. This shows that Venom-Aid works just as well as treating the length of symptoms of rattle snake bites as antivenom does. The Pearson's R value was 0.983. This shows that, since the R value is close to 1, the Venom-Aid and antivenom have a strong correlation. This shows that the Venom-Aid is just as a reliable form of treatment for rattlesnake bites as antivenom is. (Shown above is the data for rattlesnake bites) Two additional data sets were collected for people stung by scorpions. One data set includes the length of symptoms after treatment for 20 subjects given the gold standard, or antivenom, after being stung. The other data set includes the length of symptoms after treatment for 20 subjects given Venom-Aid. The t-test value from the two data sets was 0.528, showing that there is no statistical difference between the antivenom and Venom-Aid, and Venon-Aid works just as well as treating the length of symptoms of scorpion stings as antivenom does. The Pearson's R value was 0.908. This shows that, since the R value is close to 1, the Venom-Aid and antivenom are strongly correlated and the Venom-Aid is just as a reliable form of treatment for scorpion stings as antivenom is. (Shown above is the data for scorpion stings)
GraphWorks Cited Childs, D. (2008, November 7). Snakebite Threat Lags in U.S., but Still Remains. Retrieved October 8, 2014, from http://abcnews.go.com/Health/PainManagement/story?id=6200802 Davis, MD, PhD, C. (n.d.). Scorpion Sting: Read About Symptoms, Treatment and First Aid. Retrieved October 8, 2014, from Davis, MD, PhD
|
|||||||


