BME100 f2014:Group23 L2
| Home People Lab Write-Up 1 | Lab Write-Up 2 | Lab Write-Up 3 Lab Write-Up 4 | Lab Write-Up 5 | Lab Write-Up 6 Course Logistics For Instructors Photos Wiki Editing Help | |||||||
|
OUR TEAM
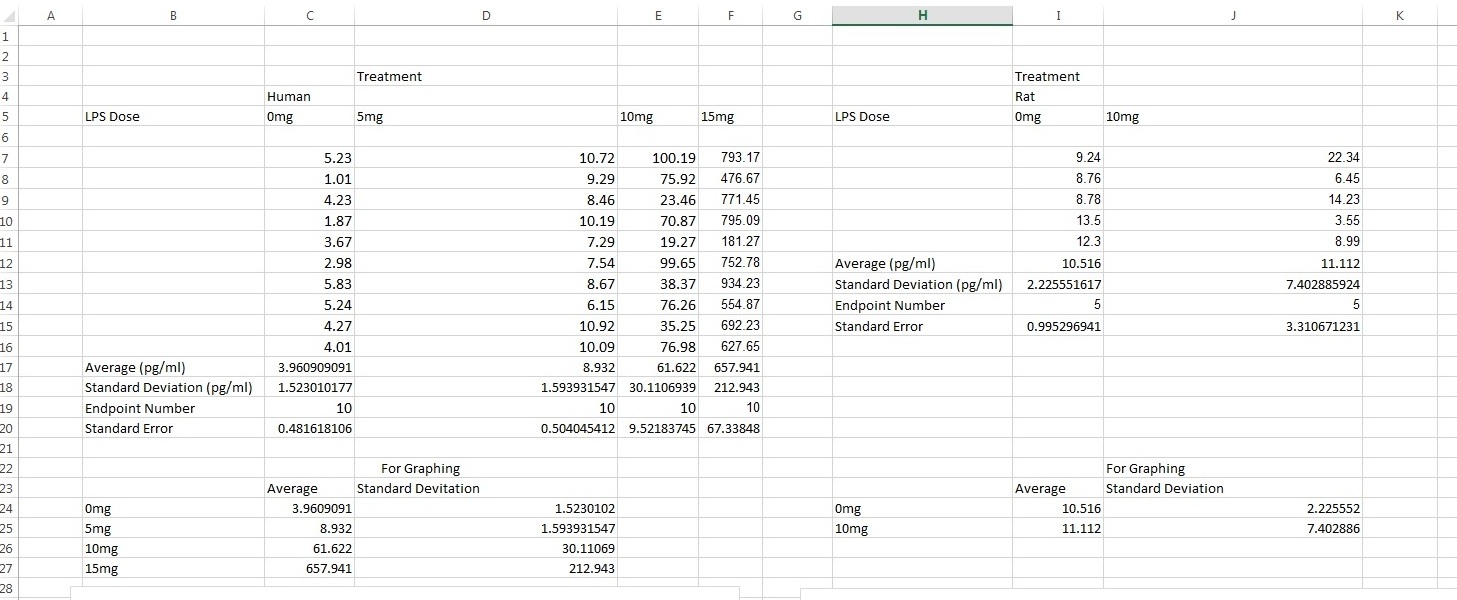
LAB 2 WRITE-UPDescriptive StatisticsExperiment 1 The standard deviation for rats given a dose of 0 mg of LPS was 2.225551617 pg/ml. The standard deviation for rats given a dose of 10 mg of LPS was 7.402885924 pg/ml. The standard error for rats given a dose of 0 mg of LPS was 0.995296941 pg/ml. The standard error for rats given a dose of 10 mg of LPS was 3.310671231 pg/ml. Experiment 2 The standard deviation for humans given a dose of 0mg of LPS was 1.523010177 pg/ml. The standard deviation for humans given a dose of 5mg of LPS was 1.593931547 pg/ml. The standard deviation for humans given a dose of 10mg of LPS was 30.11069386 pg/ml. The standard deviation for humans given a dose of 15mg of LPS was 212.9429762 pg/ml. The standard error for humans given a dose of 0mg of LPS was 0.481618106 pg/ml. The standard error for humans given a dose of 5mg of LPS was 0.504045412 pg/ml. The standard error for humans given a dose of 10mg of LPS was 9.521837451 pg/ml. The standard error for humans given a dose of 15mg of LPS was 67.33848166 pg/ml. ResultsExperiment 1
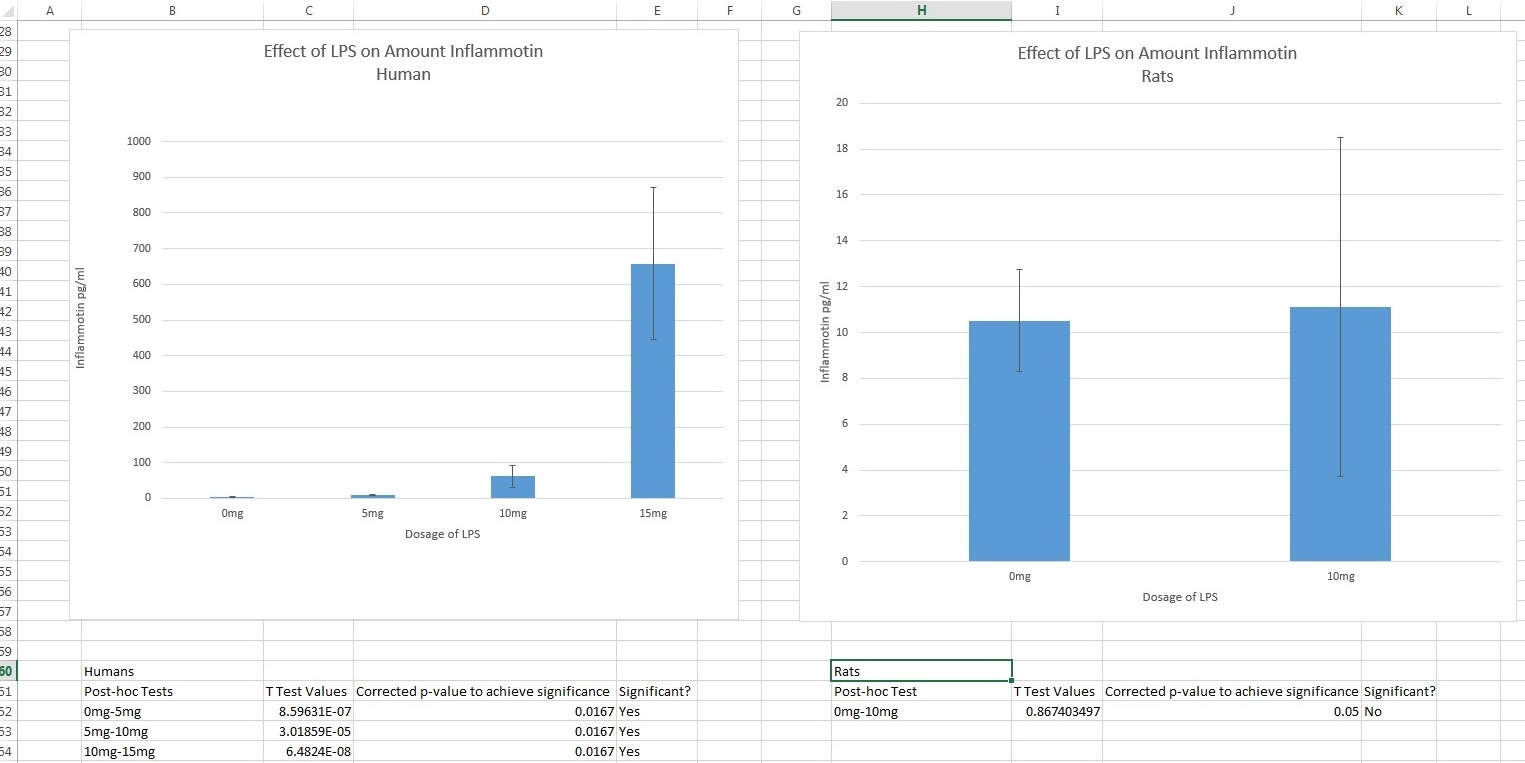
Experiment 2
AnalysisExperiment 1 H0= There is no difference in inflation levels between the rat group with the LPS dose of 10mg and the control group with the LPS dose of 0mg. Ha=There is a difference in inflation levels between the rat group with the LPS dose of 10mg and the control group with the LPS dose of 0mg. Therefore, we accept the null hypothesis.
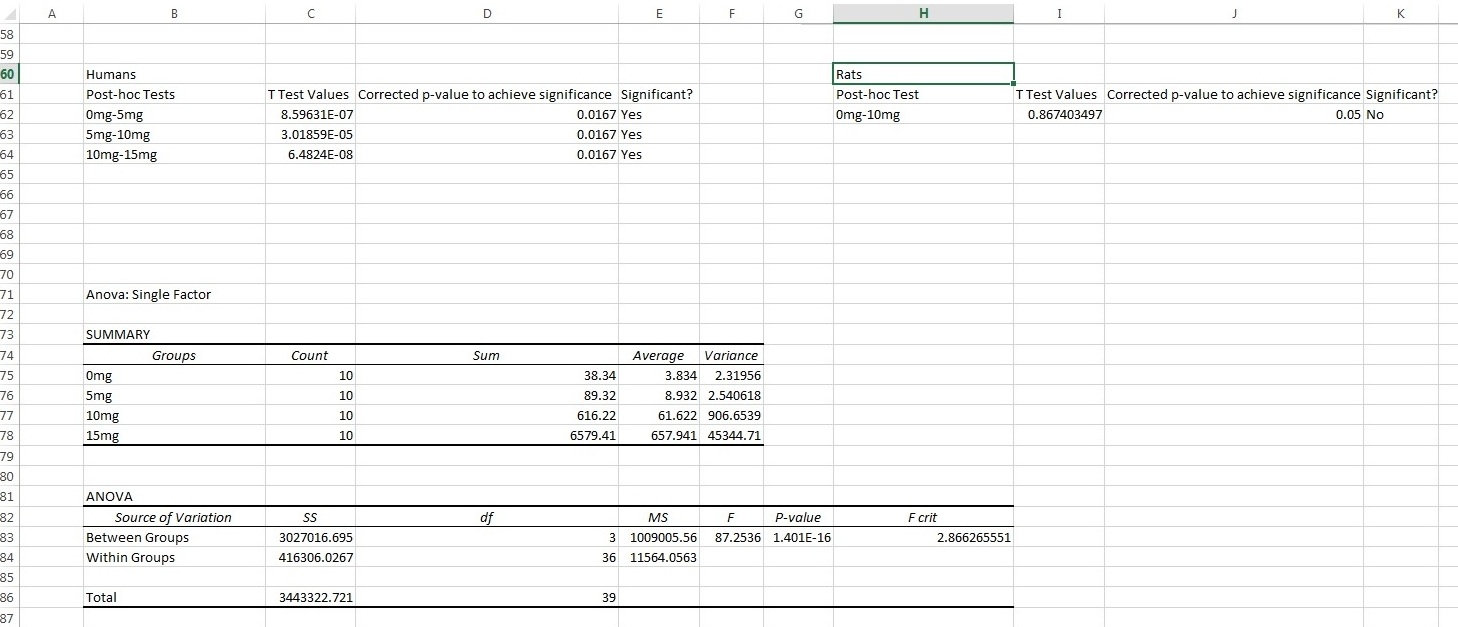
Anova: H0= There is no difference in inflation levels between the elderly group with the LPS dose of 5mg, 10mg, 15mg, and the control group with the LPS dose of 0mg. Ha=There is a difference in inflation levels between the elderly group with the LPS dose of 5mg, 10mg, 15mg, and the control group with the LPS dose of 0mg. T-tests: H0= There is no difference in inflation levels between the elderly group with the LPS dose of 5mg and the control group with the LPS dose of 0mg. Ha=There is a difference in inflation levels between the elderly group with the LPS dose of 5mg and the control group with the LPS dose of 0mg. H0= There is no difference in inflation levels between the elderly group with the LPS dose of 5mg and 10mg. Ha=There is a difference in inflation levels between the elderly group with the LPS dose of 5mg and 10mg. H0= There is no difference in inflation levels between the elderly group with the LPS dose of 10mg and 15mg. Ha=There is a difference in inflation levels between the elderly group with the LPS dose of 10mg and 15mg. Summary/DiscussionIn order to perform a 2 sample t-test, we are assuming that the selection of the subjects was completely random and unbiased and each sample is independent from every other sample. Additionally, the sample size of both rat and humans are assumed to be less than 10% of the population, in order to ensure there is the same probability of picking a random person in the population and we assume the data has a normal distribution. In the ANOVA test run on the human data, the p-value was 1.401*10^-16, meaning that there was a high difference between at least one data set and it was nearly impossible that the data occurred randomly. Using T-tests in the human data, we determined that the data was significant in humans, meaning that there was a low chance of the same data occurring randomly. Since our p-value of 8.59631E-07(0mg vs 5mg), 3.01859E-05(5mg vs 10mg) and 6.4824E-08(10mg vs 15mg) were less than our alpha level of .0167, therefore we reject our null hypothesis, we can conclude that there is a statistical difference between each dose in human trials. If the LPS does was ineffective there would be a 1.67% probability that the data was made by random chance. In rats however, there was no significance. Even though they were given a dose of LPS, there was no data to support that there was an increased amount of Inflammotin when compared to each dosage of LPS. This means that in the elderly, an increased amount of inflammation will most likely increase the amount of the protein Inflammotin. In the rats, since our p-value of 0.867403497 is lower than our alpha level of .05, we fail to reject our null hypothesis since there is no evidence to support that an increased amount of inflammation causes an increased amount of Inflammotin. It is interesting that the test on humans were significant, yet the tests done on rats were insignificant. The two tests are linked in that they were both done in a similar manner, but the data shows that rats react differently to inflammation, and did not produce more of the Inflammotin protein. This could be due to a difference in anatomy, or a different protein that rats use instead, or it could even be a lack of testing on the rats. Since fewer trials were done on them, the result was that there was more probability of it occurring randomly. However, we can conclude from the data that there is a correlation between an increase in LPS dose and an increase level of Inflammotin in human trials only. . |
|||||||


