BME100 f2014:Group21 L3
| Home People Lab Write-Up 1 | Lab Write-Up 2 | Lab Write-Up 3 Lab Write-Up 4 | Lab Write-Up 5 | Lab Write-Up 6 Course Logistics For Instructors Photos Wiki Editing Help | |||||||
|
OUR TEAM
LAB 3A WRITE-UPDescriptive Statistics
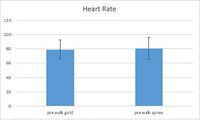
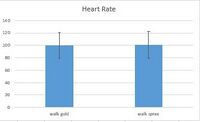
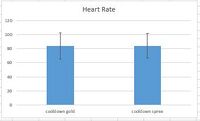
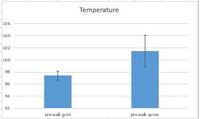
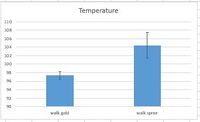
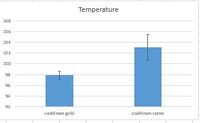
ResultsT-tests were used to compare heart rate and temperature results between the gold standard and the Spree headband. The pre-walk, walk, and post-walk data were separated from each other in case other factors may have influenced the results. There are a total of six t-tests in this experiment. The p-value is 0.761841151 for the heart rate before the walk. The p-value is 0.945387954 for heart rate during the walk. The p-value is 0.845282707 for the heart rate after the walk. The p-value is 3.95736E-14 for the temperature before the walk. The p-value is 9.93688E-19 for the temperature during the walk. The p-value is 3.51502E-15 for the temperature after the walk.
AnalysisThe data clearly shows that the Spree band is not a good alternative to the gold standard thermometer. The p-values for the pre-walk (3.95736E-14), walk (9.93688E-19), and post walk (3.51502E-15) trials are all far below the 0.05 alpha level. It differed greatly from the from the gold standard device. This is most likely due to the fact that the Spree band only listed four different measurements for temperature compared to the thermometer's wide range of temperatures. It did however work well as an alternative to the pulse oximeter for measure heart rate, when it could gather data. The p-values for the pre-walk(0.761841151), walk(0.945387954), and post walk (0.845282707) trials were all well above the 0.05 alpha level. If the Spree could continuously gather heart rate data it would be a great alternative to the oximeter, since it does not need to cuffed to your wrist and would not be so adversely affected by motion.
Summary/DiscussionThe Spree headband was accurate in taking measurements of heart rate to within a couple of beats of the gold standard since all three p-values (0.761841151, 0.945387954, and 0.845282707) were larger than 0.05. The Spree headband was not accurate when taking temperature, as all three p-values (3.95736E-14, 9.93688E-19, and 3.51502E-15) were less than 0.05. Temperature was an inaccurate measurement as there were only four different temperature readings, while the gold standard has a wide range of temperatures. While accurate at measuring heart rate, the Spree would cut in and out of service and be unable to read heart rate for a couple of minutes. It would often take multiple attempts to get one heart rate reading. While the cause for this abnormality was undetermined, it was known that the dropped service was not due to other nearby groups. Wearing the Spree headband in public could cause limited embarrassment in some individuals. The Spree headband was also relatively large for the head so it didn't fit like it should have. The Spree headband became uncomfortable to wear after an hour and was hard to adjust how tight it was on the head. Wearing the Spree headband in an exercise setting also caused a minor headache from the level of tightness it had. Adjusting the tightness of the Spree headband was impractical to do while excising since the sensor would cut out and not work while not in contact with the head.
LAB 3B WRITE-UPTarget Population and NeedA traditional x-ray is slow, expensive, and puts patients in awkward positions. The Y-Ray is targeted at doctors, emergency rooms, hospitals, and any other licensed medical facility in need of an x-ray machine. It is intended to speed up the process of taking an x-ray without having to sacrifice any of the accuracy of a traditional device. There quickness of the Y-ray reduces the time spent in the medical facility and gives a faster diagnosis. Not only is it intended to speed up the process, but it also is made to take x-rays without forcing the patient into to awkward positions. It can be manipulated so that it can take an x-ray of the chest or the back without forcing the patient to lay awkwardly on their side. This helps a need in medical facilities, as some patients are physically unable to stay on their side (burn victims or paralyzed patients). The Y-ray can wrap around limbs and joints, making it convenient for both the patient and doctor. The Y-ray is also substantially cheaper than a traditional machine, helping the need to cut costs in medical facilities.
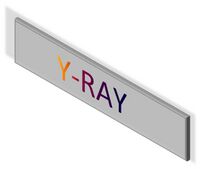
Device DesignThe device is designed to be as portable and flexible as possible. The fact that the x-ray was cumbersome and hard to manipulate to the patient's needs made it hard to get fast results. The device's small size addressed the need to create a more portable x-ray machine, and the form fitting flexibility made it possible to take x-rays on parts of the body that were previously very hard to get an image of, such as the ankle or wrist.
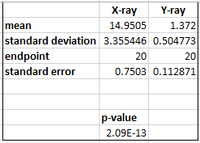
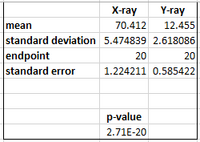
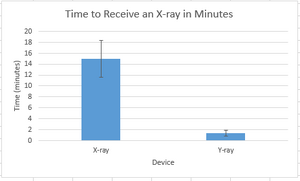
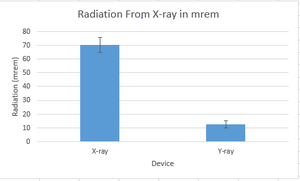
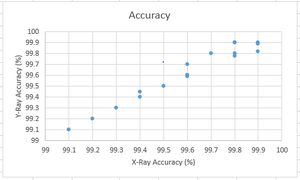
Inferential StatisticsThe p-value for the time to process the image is 2.09 E-13. Since the p-value is less than 0.05, there is a statistical difference between the time to take an x-ray and the time to take a Y-ray. The Y-ray is faster than an x-ray. The p-value for the radiation is 2.71 E-20. Since the p-value is less than 0.05, there is a statistical difference between the radiation from an x-ray and a Y-ray. The Y-ray emits less radiation than an x-ray. The Pearson's r value for accuracy is 0.979574. Since the Pearson's r value is over 0.95, there is statistical evidence that the Y-ray is as accurate as the x-ray.
Graph
|
|||||||


