BME100 f2014:Group1 L6
| Home People Lab Write-Up 1 | Lab Write-Up 2 | Lab Write-Up 3 Lab Write-Up 4 | Lab Write-Up 5 | Lab Write-Up 6 Course Logistics For Instructors Photos Wiki Editing Help | |||||||
|
OUR COMPANY
LAB 6 WRITE-UPBayesian StatisticsOverview of the Original Diagnosis System After having several random students submit their DNA for a disease marker, 34 teams each go through the diagnosis process to process and analyze the DNA. Each group was given three replicate DNA samples from two patients and the results of the PCR analysis were recorded in a statistical sheet with all the teams. The analysis concluded if the patient was diagnosed with a disease-associated SNP or not. It is essential to prevent error so a patient is not misdiagnosed. Due to this risk, the lab was conducted in a controlled and systematic manner in which each group handled a only two patients. Also, a specific procedure was followed by each group to avoid any discrepancies between how the data was handled or analyzed. Lastly, the same PCR analysis technique was used by all the groups. Additionally, to confirm the results, three different drop images were used to avoid error as well as be as accurate and precise and possible. When analyzing through ImageJ, it was made sure that the oval that was produced was as accurate and precise as possible for each of the trials. The results of the class data was a valid experiment in which we concluded some effective results. The data resulted in successful positive and negative results from which it was successfully concluded that the SNP was directly correlated to a cardiovascular disease.
Calculations one and two imply that results for the individual PCR replicates are very reliable in determining whether a patient has the disease SNP or not. Both of the Bayes values, for calculations one and two, were very close to 1.00 (100%). Possible sources of error could be from human contamination, a defect in the PCR machine, the sample being used could have interfering substances in them that cause an incorrect result, or by not setting the baseline and the threshold correctly. All of these errors can cause the PCR machine to give an incorrect result. Human contamination and interfering substances can cause the PCR machine to replicate the wrong DNA strand. A machine defect or an incorrect threshold and baseline can cause the machine to err during the process and the result may be skewed because of this.
The calculations for three and four imply that the PCR is not vey reliable in diagnosing or predicting the disease. The Bayes values were not very close to 1.00 (100%). For both calculations three and four, the Bayes value was actually closer to zero. The results from all four calculations show that the PCR is reliable when detecting a developed disease, but cannot be relied upon to predict a developing disease. Computer-Aided DesignTinkerCAD The TinkerCad tool is a 3D building software that has preprogrammed shapes and tools that help build realistic objects in a virtual atmosphere. TinkerCaD was the main tool that we used during Computer-Aided Design lab. We imported the original design for a PCR machine and then proceeded to make design modifications and additions until the design became an original and unique PCR. We used the provided shapes in the TinkerCad program in order to make parts for the machine. We used the helper tools on the TinkerCad program in order to measure the parts out and to line them up correctly and create the most cohesive machine possible. Our Design
Feature 1: Consumables KitThe consumables kit will be included in the same OpenPCR package. The consumables kit will include a Master Mix that is composed of SYBR green, taq polymerase, a buffer, and dntps (nucleotides). This mix will be a general mixture with correct proportions of each liquid reagent. If a specific case requires more of a single liquid reagent, more will be provided in the starter kit, which will have a total of ten Master Mix packets.
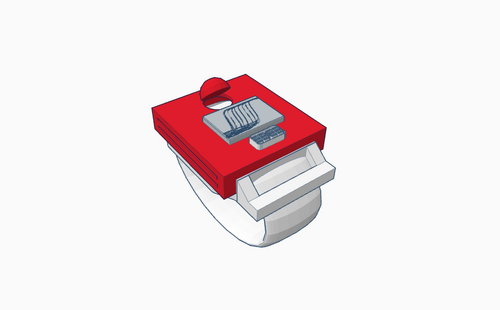
Feature 2: Hardware - PCR Machine & FluorimeterThe thermocycler was used for the PCR reaction needed to amplify the KCNE2 region of our DNA samples. The thermocycler goes through a series of cycles that are called denaturation, annealing and then elongation. Denaturation allows the DNA strands to separate. Annealing allows the specific primer for the mutated KCNE2 gene being searched for to attach to the correct DNA region. If the single nucleotide polymorphism is there then that DNA region will be amplified in the elongation process, if not then it will not be amplified. The elongation process has deoxyribonucleotides being attached to the primer by the enzyme taq polymerase. This process has many cycles and each cycle doubles the number of DNA copies being made. After being amplified in the thermocycler, a fluorimeter using a smart phone was made use of. The smart phone would take a picture of the DNA and the SYBR Green mix. The SYBR Green would attach to DNA and make it glow green. This is important to tell the difference between a highly concentrated sample and a low concentrated sample. Triplicate pictures would be taken of each sample along with the positive and negative controls. These pictures would then be run through a computer program that could convert the fluorescence of each mix and then give an estimation of the concentration of the sample. The concentrations of each sample could then be compared to the concentration of the positive and negative controls. To simplify this process the thermocycler and fluorimeter system will be combined. So it will be possible to see the results in real time. At the end of each cycle a light will be sent through the sample to see the amount of DNA that is currently there. By the end of the experiment there will be a curve that shows the amount of DNA that was present at each cycle. The earlier the curve the more concentrated the sample was and the more that specific gene was amplified. The device will also be made smaller into a watch. Though only one sample can be put into the device at a single time. The watch will come with a few tubes of our Master mix solution that has everything needed to go through with the experiment except for the primers. The reason the primers must be bought separately so that whoever is using this device can tailor their experiment to a specific gene they are searching for. The watch will have a digital screen showing the curve as it is being made. On the other part of the watch there will be a place to input the DNA sample. The master mix and primers can be inputted into the watch beforehand. After that the DNA can simply be added and press “Start Run” on the screen and watch as the data rolls in from your Wrist Cycler.
| |||||||


