BME100 f2014:Group19 L2
| Home People Lab Write-Up 1 | Lab Write-Up 2 | Lab Write-Up 3 Lab Write-Up 4 | Lab Write-Up 5 | Lab Write-Up 6 Course Logistics For Instructors Photos Wiki Editing Help | |||||||
|
OUR TEAM
LAB 2 WRITE-UPDescriptive Statistics
Inferential Statistics
We performed a Post-Anova Test because each LPS-dosage needs to be compared to each other before it can be determined if the data is statistically significant. The alpha value (.05) is divided by the number of each comparison. And so, all the p-values need to be less than the new given alpha value: .05/6=.00833 Since all the p-values of each comparison were less than the new alpha value, then there is a statistical difference in the inflammotin levels!
AnalysisHuman Experiment
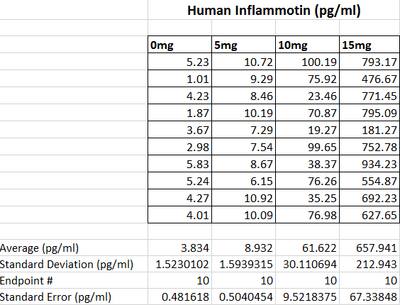
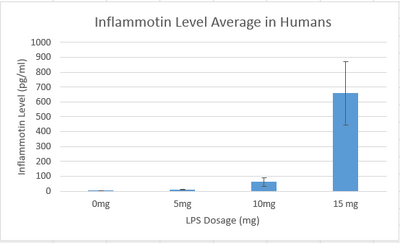
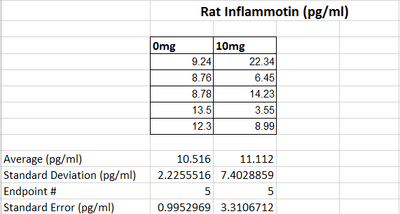
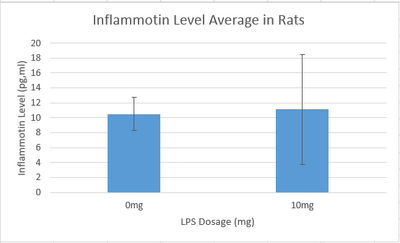
Summary/DiscussionAs the dosages of LPS increased throughout the human trials, there was a significant change in the amount of inflammotin protein. As shown by the averages in the graph, the inflammotin levels significantly increase as the dosage levels get bigger especially between the 5mg dose and the 10mg dose.However, as the dosage increases, the standard deviation also increases significantly. This is evidence that the drug affects each person differently especial as the dose of LPS reaches 10mg and 15mg. In the rat experiment through the t-test it was found that there is no statistical difference between the two dosages tested in the experiment. As shown by the graph, as the dosage of LPS went up, there was no real change in the amount of inflammotin protein. The slight increase of the higher dosage is due to an outlier in the data, which explains the high standard deviation in the data corresponding to the 10mg dose. In the human trial there is a statistical difference between the dosages of LPS and human inflammotin, while in the rat trials there is not a statistical difference between the two dosages of LPS and rat inflammotin. Therefore, it can be concluded that LPS has no effect in inflammotin protein production in rats, only in humans. LPS only produces the desired effect in the human body. |
|||||||


