BME100 f2014:Group18 L3
| Home People Lab Write-Up 1 | Lab Write-Up 2 | Lab Write-Up 3 Lab Write-Up 4 | Lab Write-Up 5 | Lab Write-Up 6 Course Logistics For Instructors Photos Wiki Editing Help | |||||||
|
OUR TEAM
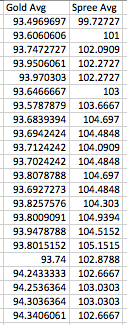
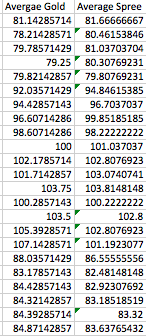
LAB 3A WRITE-UPDescriptive StatisticsAverages for "Heart Rate" and "Temperature" were taken at certain time intervals from each group with correct data resulting in the descriptive statistics below.
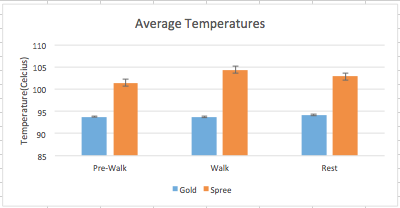
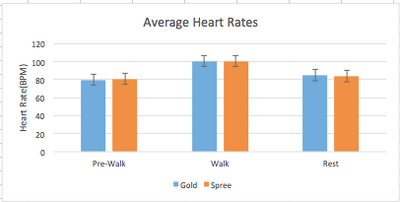
ResultsT-tests were performed between the data from the gold standard tool and the Spree band. Because the data was based on the connected topics and was from the same subject, it was a paired test. Averages of the temperature and heart rate averages were calculated and then separated into three time interval groups: pre-walk, walk, and cool down. This data was analyzed and graphed.
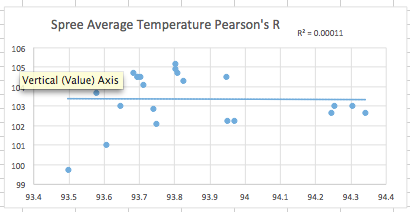
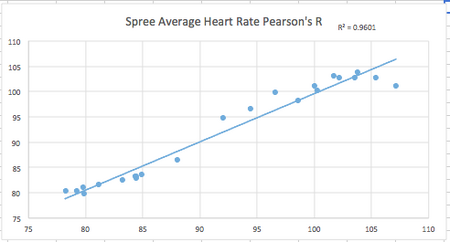
AnalysisScatter plots were made for the temperature and heart rate data. Pearson's R correlation was sketched on the plots to test the validity and accuracy of the Spree band's performance data.
Summary/DiscussionUltimately, the data supports the hypothesis that the temperature reading for the Spree device needs some work. This conclusion makes sense because the Spree device only had the capabilities of measuring on a scale of 1-4, whereas the Gold Standard Device read actual body temperature. Additionally, the Gold Standard measured inside body temperature and the Spree device measured outside forehead temperature. This is shown more clearly when looking at the P-value (obtained from our T.Test) and Pearson's R correlation values for temperature. Our P-Value showed that there was definitely a statistical difference in measurements in our two devices. Ideally, we want NO statistical difference. On the other hand, the heart rate monitor for the spree device seems reliable. This is shown by our P-value (from the T.Test) and Pearson's R value. Our P-value was large, close to 1, which meant that there was NO statistical difference in measurement between the two devices. This is good because ideally we want a device to be as accurate and reliable as the gold standard device. Also, our Pearson's R value was very close to 1 confirming that our data from our Spree device had a strong correlation to the gold standard device. There are a couple of design flaws regarding the Spree Device. To begin, the makers should design a better way of determining which device belongs to who on the iPhone App. When trying to locate our device on the app, we had to get as far away from other device users as possible. Consequently, there is a strong chance of reading someone else's device and data through the app. It could also become a privacy issue as well. Finally, the head band could use help in looking more stylish and aesthetic. It looks a little awkward on the wearer. Consumers want to wear products that look more natural and stylish, rather than something that clearly looks like a medical device.
LAB 3B WRITE-UPTarget Population and NeedeyeSweat is obviously for anyone who wears socks! More specifically, eyeSweat is targeted toward athletes and/or people concerned with their hydration. Since water is necessary for survival; our organs, tissues and cells need water to properly function. Our fluids need to be replaced, which is why our device will be significant and useful. Our device shows you how much sweat you have lost and how much fluid you need to replace what was lost. Our product is designed to examine your sweat output during any extended period of time.
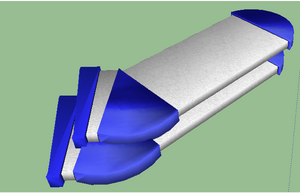
Device DesignOur device design is quite simple. It has polymer integrated into the sock fabric that tracks the sweat output over any extended period of time. To give you the necessary data to track your sweat output, there is a sensor that lines the inside of the sock around the bottom of the foot. Additionally with this sensor, there is Bluetooth technology wired into the fabric that translates the sweat loss from the sensor to an app that can be accessed via smartphone. The output on the smartphone will show the sweat loss in ounces and will also calculate how much fluid you will need to replace depending on what has been lost.
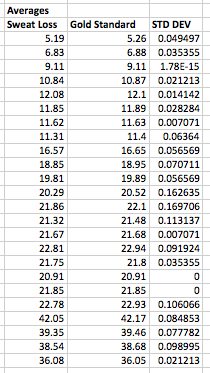
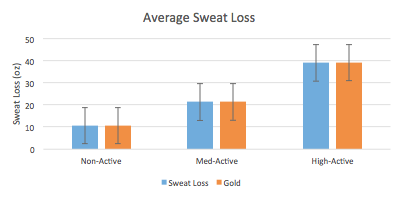
Inferential StatisticsOur inferential statistics show measured averages of sweat loss of various persons. The measurements vary equally between non-active, medium-active, and highly-active people. Our device measurements are also shown and compared to the gold standard measuring device to clarify our devices validity and accuracy.
GraphOur graph shows the comparison of measured average sweat loss of non-active, medium-active, and highly-active persons, between our eyeSweat device and the gold standard measuring device. As shown in the graph, our device is very accurate and provides readings that are very close to the gold standard measurement.
|
|||||||

