BME100 f2014:Group14 L2
| Home People Lab Write-Up 1 | Lab Write-Up 2 | Lab Write-Up 3 Lab Write-Up 4 | Lab Write-Up 5 | Lab Write-Up 6 Course Logistics For Instructors Photos Wiki Editing Help | ||||||||||||||||||||||||||||||||||||||||||||
|
OUR TEAM
LAB 2 WRITE-UPDescriptive StatisticsHuman Experiment Rat Experiment
Results/GraphsHuman Experiment
Rat Experiment
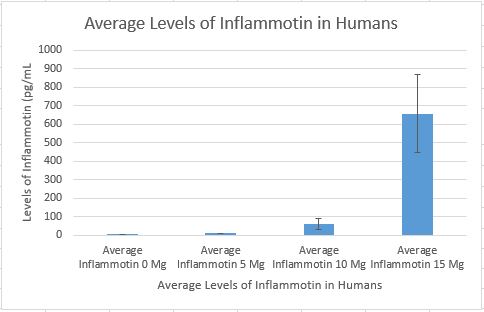
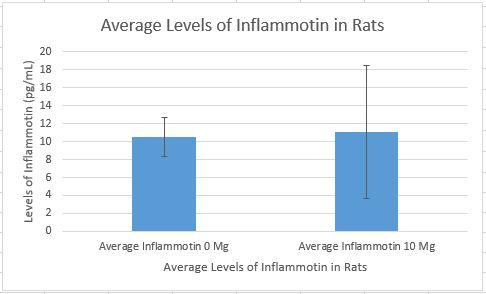
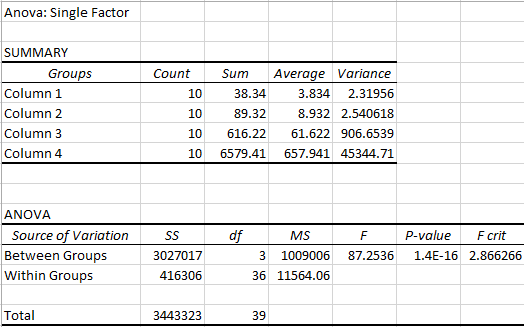
Analysis/Inferential StatisticsIn the human trial, various dosages of inflammotin are being tested, thus it is necessary that an ANOVA test be conducted. This test allows us to determine the overall percent error as well as sum, average and variance both between and within variables. The overall error reported on this ANOVA is 1.4x10^-16, well within the desired .05 range. Since the ANOVA test numerous samples, a post- hoc test must be taken to determine the p-values between the individual data sets. The p-value here is adjusted to 0.0083 because we had to divide our standard error, 0.05, by the number of samples, 6. Since there are only two areas of comparison in the rat trail, a t-test was taken. Here we compared the variances between the rats who received no inflammotin and thos who received 10mg dosage. The p-values here exceed our limit of .05, illustrating a significant difference within the data Analysis The most significant difference about the human and rat trial, is that when there is 0 Mg of inflammotin in rats, they showed to produce 10.516 pg/mL of protein in their system. On the other hand, humans showed to have 3.834 pg/mL of protein. However, when rats were introduced 10 Mg of inflammotin, they produced 11.112 pg/mL of protein, while humans produced 6 times more. An ANOVA and t-test were extremely helpful when determining average dosage of inflammotin in a system. With these tables, group means and differences were distinct and simple to identify. As a whole, there could have been various errors that could have occurred, as well as could have gone better. For example, the abundance of data could have lead to misinterpretation when producing the ANOVA and t-test tables. In addition, there could have been subjects who were not able to complete the experiment or were not able to follow the requirements.
Summary/DiscussionThe data shows that the LPS treatment did increase the Inflammotin protein levels in blood samples as Kristin predicted. As the dosage of lipopolysaccharide increased, the levels of the Inflammotin protein also increased. This increase was expected because the LPS treatment has previously been shown to increase the protein levels in the elderly. In humans, 15 Mg increases the Inflammotin levels the most (650 pg/mL) while 0 Mg did not increase the Inflammotin levels. In rats, 0 Mg resulted in 10.516 pg/mL and 10 Mg resulted in 11.112 pg/mL, which is a slight change and does not show a significant increase of Inflammotin. The standard deviation in humans also increases as the dosage increases; the standard deviation is highest with 15 mg (212.9429762) and lowest with 0 mg (1.523010177.) The standard deviation in rats also increased as the dosage increased with the highest standard deviation in the 10 mg (7.402885924) and the lowest with 0 mg (2.225551617.) Sources of error in the lab could be from small sample sizes, especially in the rats. Because both the data from the rats and the humans show an increase in Inflammotin protein levels, it can be concluded that lipopolysaccharide increases the protein levels. |
||||||||||||||||||||||||||||||||||||||||||||


