BME100 f2014:Group13 L3
| Home People Lab Write-Up 1 | Lab Write-Up 2 | Lab Write-Up 3 Lab Write-Up 4 | Lab Write-Up 5 | Lab Write-Up 6 Course Logistics For Instructors Photos Wiki Editing Help | |||||||
|
OUR TEAM
LAB 3A WRITE-UPDescriptive StatisticsBody Temperature
Heart Rate
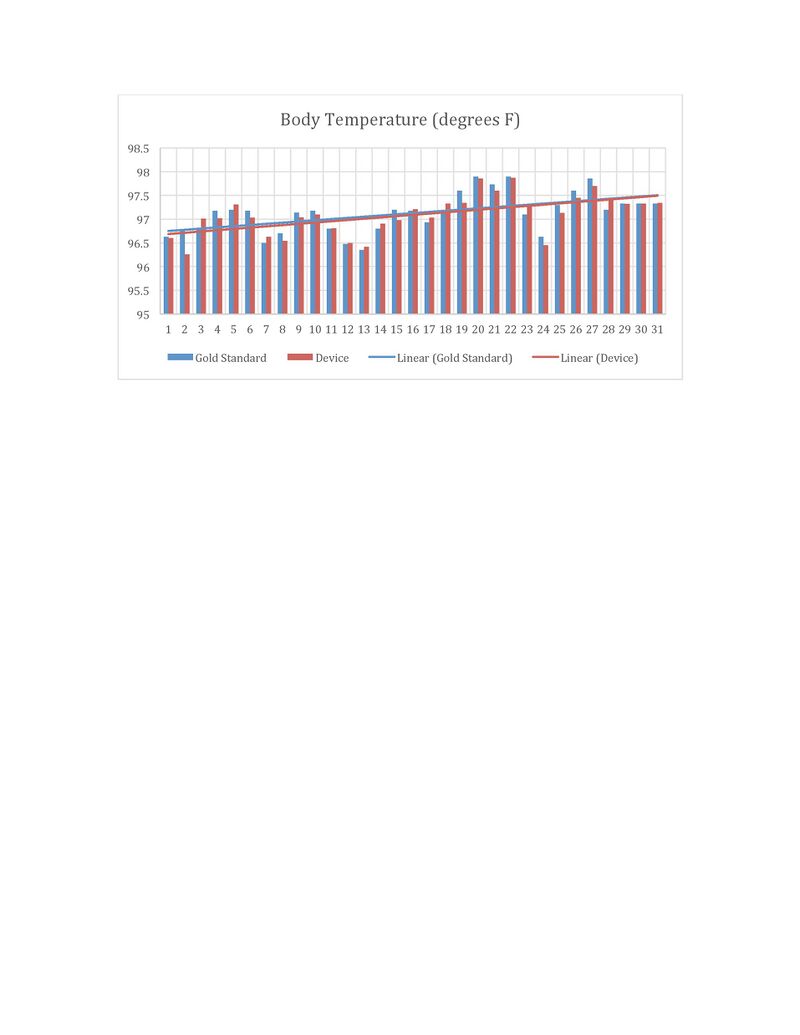
ResultsBody Temperature
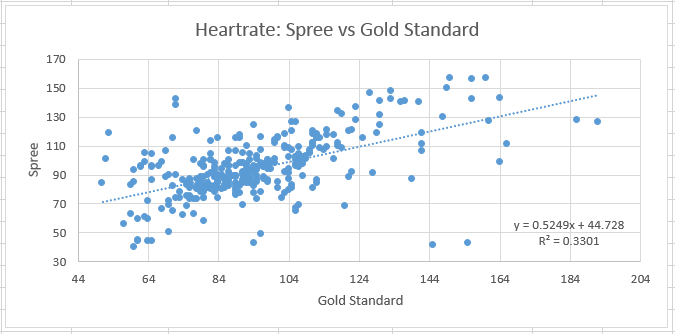
Heart Rate
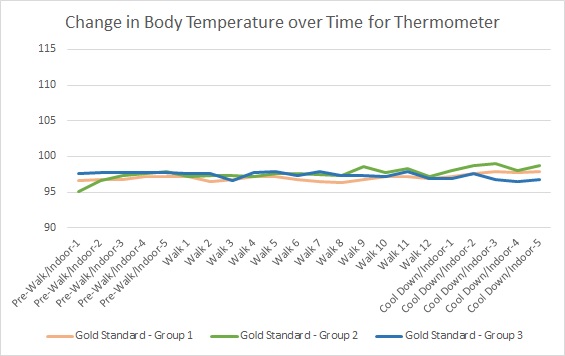
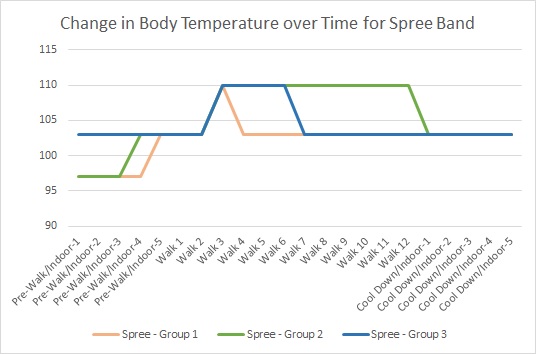
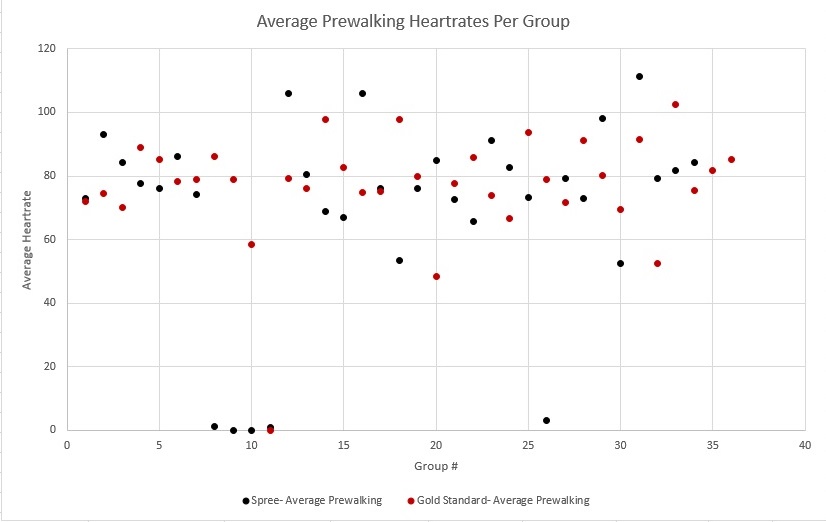
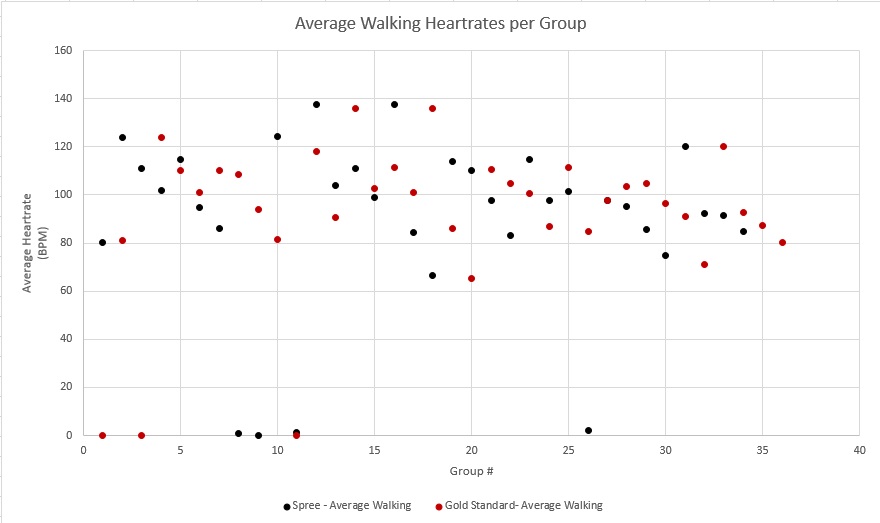
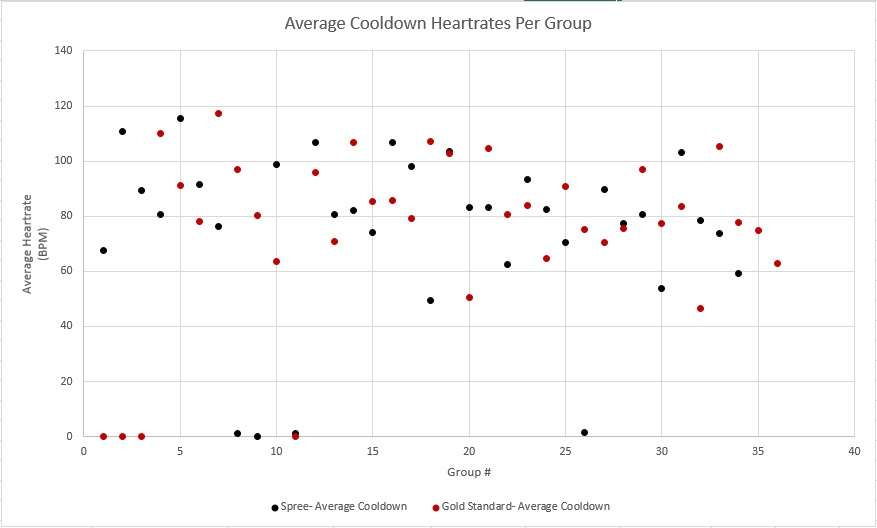
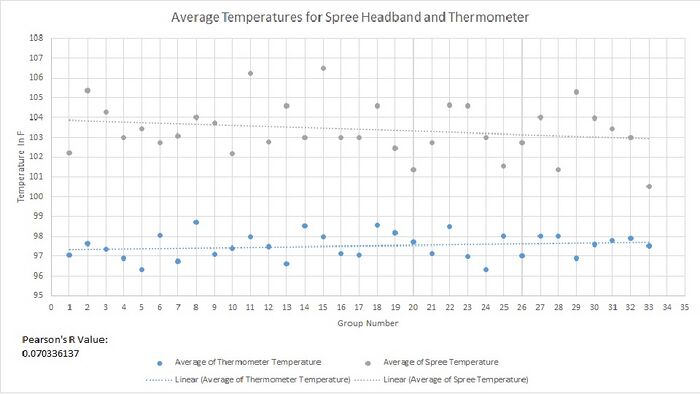
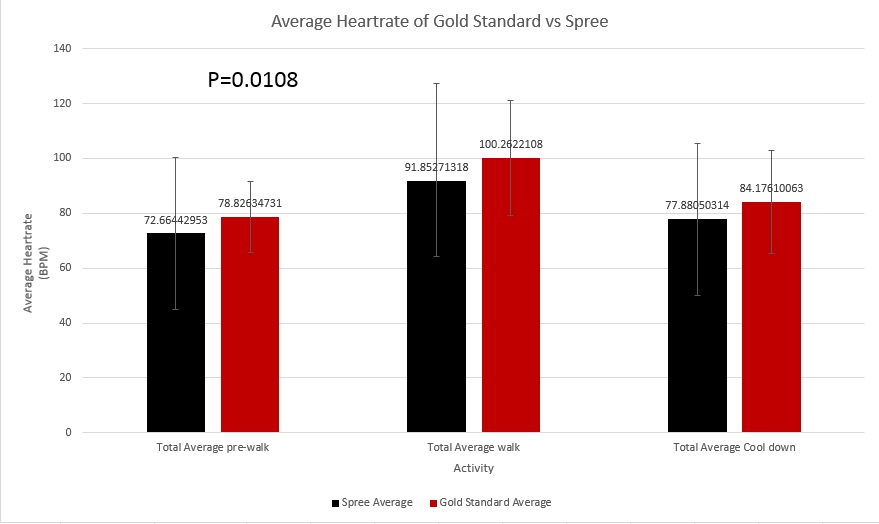
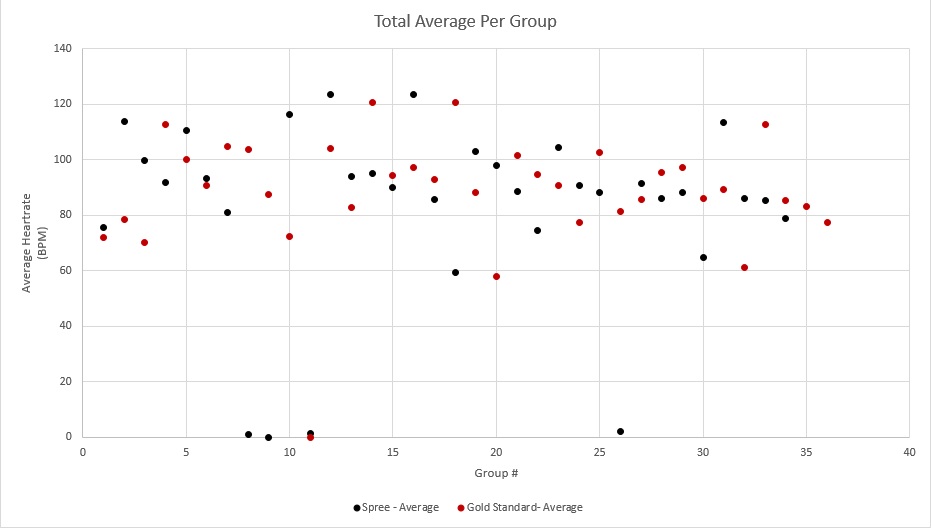
AnalysisThere is a statistical difference between the temperature data that the Spree headband provides and the gold standard oral thermometer. A t-test was performed on the average data of every group in order to compare the data collected from the Spree versus the data collected by the oral thermometer. The resultant p value was 4.96E-32, basically zero, which is much smaller than 0.05 and thus statistically significant. The p-value shows that the Spree headband was far from precise, presuming that the gold standard measurements were relatively accurate. The gold standard temperatures remained fairly constant as they were a reflection of the body's core temperature. The Spree headband was far less accurate, and reported higher body temperatures because the device's built in thermometer lies on the surface of the skin which is not an accurate measure of temperature because the skin is used to regulate core body heat and is not as stable as internal body temperature. The heart-rate data of the spree headband and the gold standard finger-worn heart rate monitor device shows statistical difference between the two. A t-test was conducted on the average data with in every group to examine the data collected from the spree vs the oral thermometer data. The p value result was 0.0108, less than 0.05, thus their is statistically difference , but not significant. The graph of p- value illustrates that the spree was almost the same as the finger heart rate monitor , assuming that the finger heart-rate monitor is accurate. Excluding the data from the groups that show results of zero, for its impossible to get this measurement for heart rate, unless the person measured for is dead. Summary/DiscussionThe Spree headband is a flawed device. There is no correlation between the temperature measurements of the gold standard and the spree headband. This is most likely due to the fact that the Spree measures these temperatures from the skin of the forehead. This method is inefficient because heat is released through the skin, causing body temperatures to be recorded as higher than they actually are. To fix this design flaw, a more proper method of measurement would be an internal thermometer, which would involve eating a thermometer, or a thermometer that would be inserted into the mouth or ear. The Spree headband also only measures in 4 levels instead of specific temperatures. It is difficult to compare the device's accuracy to the gold standard when the Spree does not even measure in degrees. This flaw can be fixed by more specific recordings and using more a more accurate thermometer, like what was mentioned earlier. The heart rate monitor of the spree headband could be improved by a new placement of the band over a major blood vessel.
LAB 3B WRITE-UPTarget Population and NeedThe Olympium band is for everyone. An all in one monitoring device, it provides 24/7 health and body monitoring function for those of any age group. Due to its high tech nature the device would, in particular, be marketed to those that are technologically adept and who want to remain informed about their health and levels of activity. Adults aged 18-40 would be our biggest market. The Olympium band measures heart rate, body temperature, blood pressure, blood glucose, blood oxygenation, sleep cycle, hydration levels, as well as being equipped with a pedometer, barometer, speedometer, and gps capabilities. In addition to the features listed above, one of the downfalls of current wrist-worn health monitoring devices is that they are too bulky during exercise and may feel uncomfortable to the wearer. Olympium solves this problem through its minimalist design and the dispersion of sensors throughout the band to make the device small and practically unnoticeable to the wearer during exercise. Another great feature of this minimalist design is that it is energy efficient as well, providing accurate health monitoring for up to a month on a single charge cycle, something other health monitors wish they could do. The Olumpium band is also suited for those who have certain health conditions. Olympium is an accurate, all in one, non intrusive, health monitoring device that is approved by physicians across the world. Through partnerships with many hospitals and care agencies, health data can be sent directly to the physician through our services, as well as through email and text messaging. Data can also be set to be sent at regular intervals or even be constantly monitored by a physician to those who have a condition, have recently been discharged from the hospital, or are concerned about a condition developing. Due to the non intrusive nature of the device, as well as the option of constant health monitoring at home, the Olyimpium band provides a cheaper, more convenient alternative to inpatient monitoring.
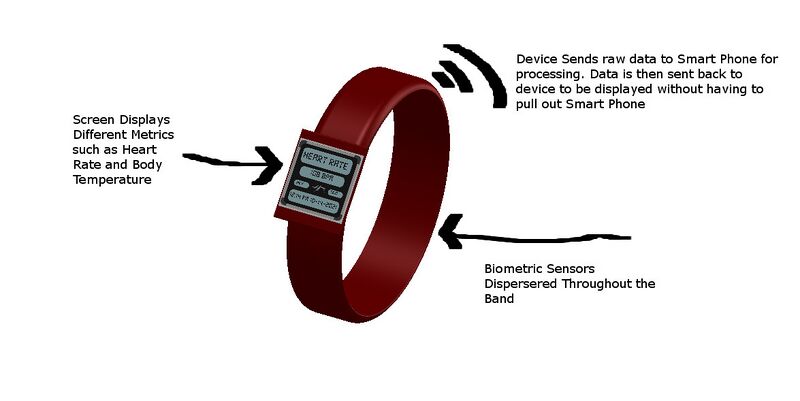
Device DesignThe Olympium band is a rubber wrist band with bio metric sensors implanted in various places in the band, rather than in a single location. The Band has a pressure sensor to measure the heart rate from the veins closest to the band, a thermometer that reads the wearer's temperature, a photodetector to measure the absorbency of light by the blood to measure the blood oxygen level, and a radio wave emitter and receiver on opposite ends to measure blood glucose levels. All raw data is sent to a smart phone, and is calculated to correct the data, and then the data is sent back to the device for display. This is done through a Bluetooth Connection that is also in the device. The device will house a lithium ion battery throughout the band as well, giving the device a large enough battery to last it a month on a single charge cycle.
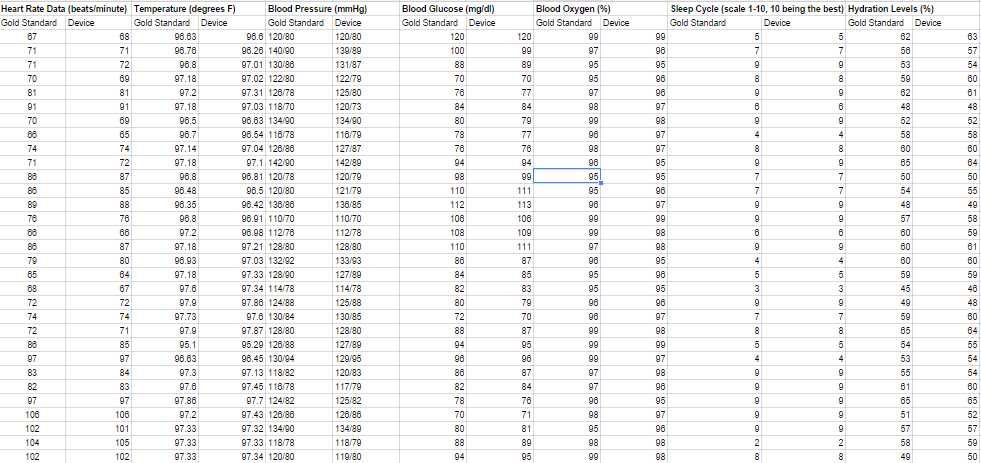
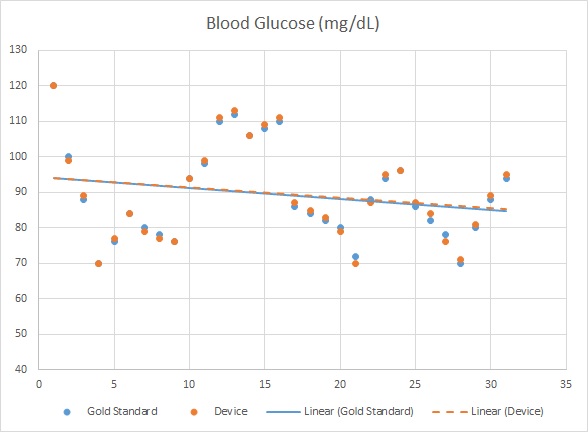
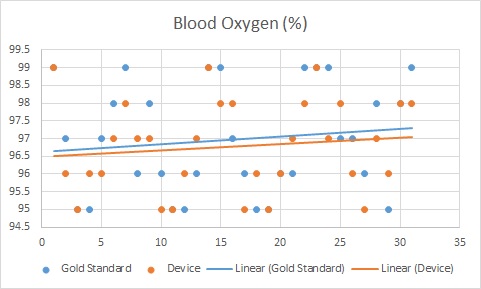
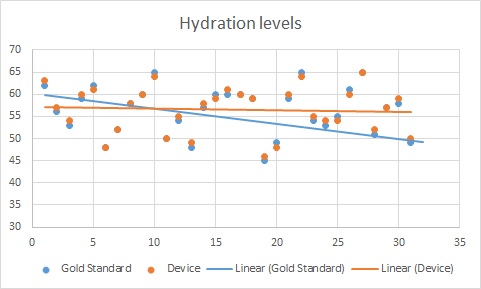
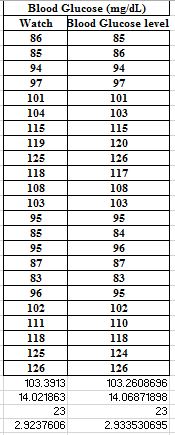
Data Set and Inferential Statistics
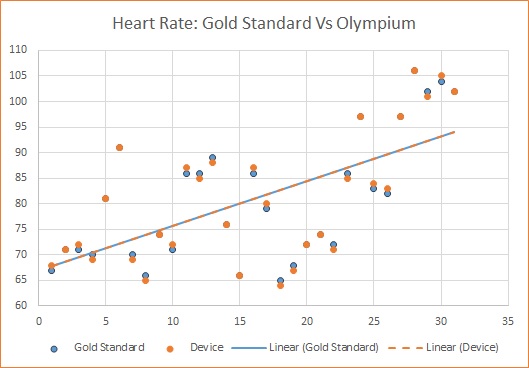
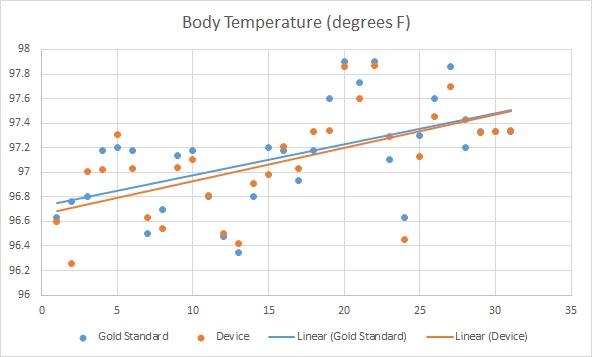
Graph
|
|||||||

