BME100 f2014:Group12 L3
| Home People Lab Write-Up 1 | Lab Write-Up 2 | Lab Write-Up 3 Lab Write-Up 4 | Lab Write-Up 5 | Lab Write-Up 6 Course Logistics For Instructors Photos Wiki Editing Help | |||||||
|
OUR TEAM
LAB 3A WRITE-UPDescriptive StatisticsTemperature Heart Rate
ResultsTemperature Pearson R Value:-0.02885863 Heart Rate
Pearson R Value: 0.98445155
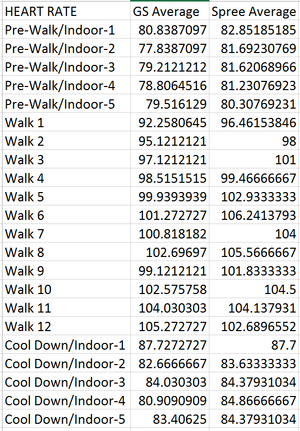
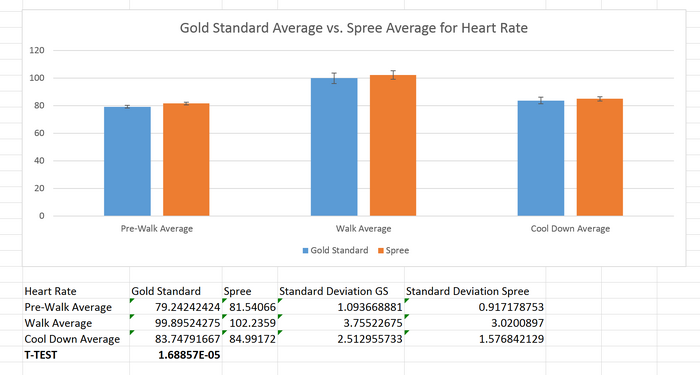
AnalysisTemperature P-Value: 0.5 The T-Test for temperature shows that the data is not significant because the p-value is greater than 0.5. This means there is not a significant differnce between the two devices. Heart Rate P-Value:0.5 The T-Test for heart rate shows that the data is not significant because the p-value is greater than 0.5. This means there is not a significant differnce between the two devices.
Summary/DiscussionThe start up company, Suntronic has asked us to test one of the latest heart rate and temperature monitors for smart phones by Spree Sports. To test the validity of the Spree Sports head band and app, temperature and heart rate readings from the device were compared to temperature and heart rate readings from oral thermometers and pulse oximeters. The readings given by the oral thermometers and the pulse oximeters are considered the gold standard. Upon comparing the results from the Spree Sports sensor to the thermometers and pulse oximeters, several design flaws were noted. The initial flaw noticed in the design was the bluetooth connection. The Bluetooth system of spree doesn’t work very well, so there was difficulty syncing the Spree sensor to the electronic applications on the smart phones. If the bluetooth connection cannot be improved, it is recommended that each Spree sensor come with a code that can be manually put into the application on the phone.
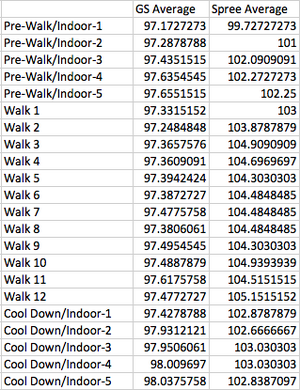
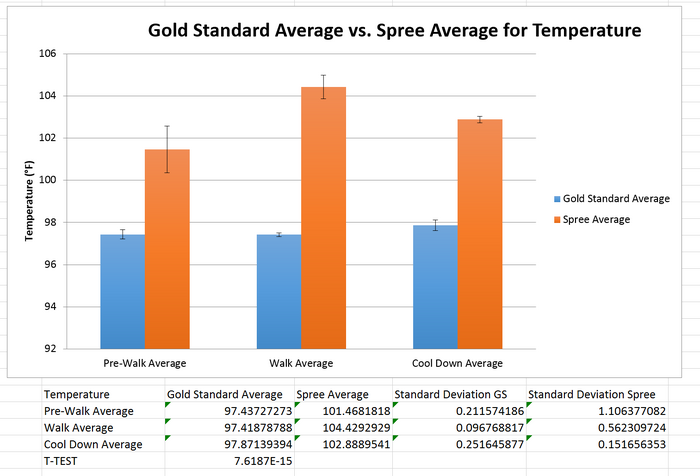
However, the values obtained from the T-test for the temperature calculations were not significant (percent error=7.6187E-15). The Pearson correlation was far from 1 (Pearson's R=-0.02886) because the temperature measurements given by the spree were different from the gold standard temperatures. This indicates that the Spree sensor and app have critical flaws that need to be fixed in terms of temperature readings.
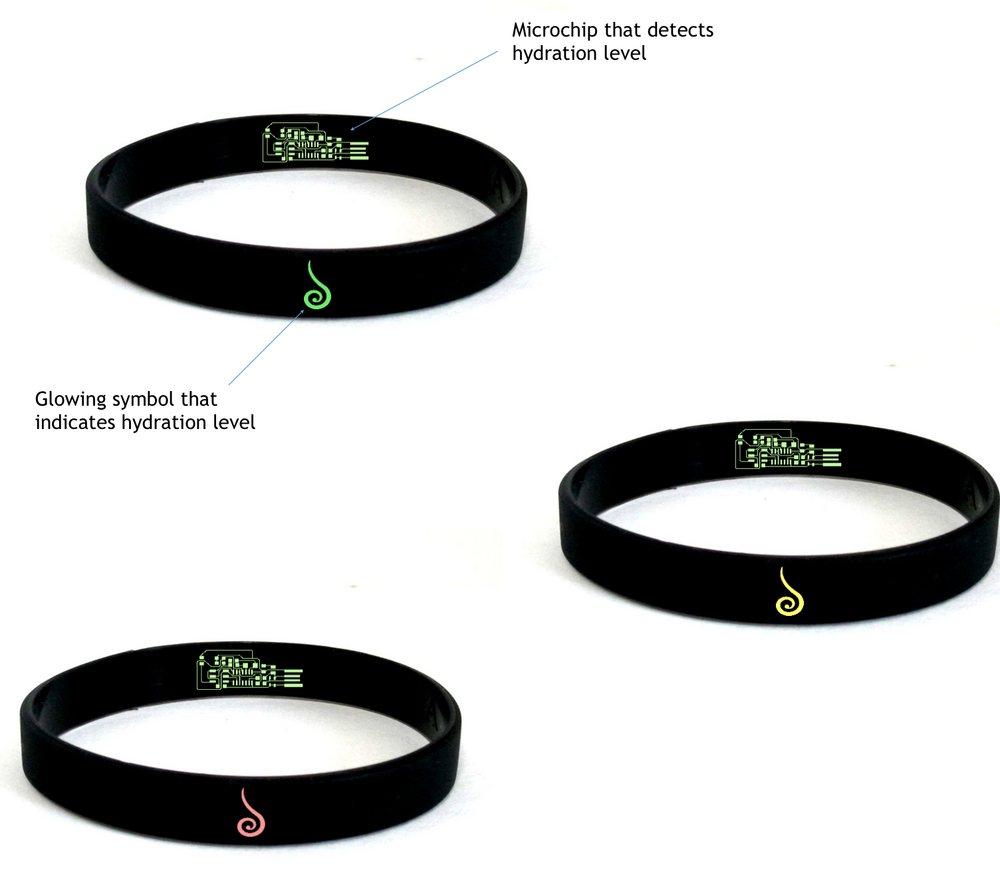
LAB 3B WRITE-UPTarget Population and NeedThe target population for the "Hydraband" will be any individual who wishes to track their hydration; in particular, the Hydraband is designed for athletes to use in order to maximize their performance. The individuals who would need the product would be anyone who wishes to be safe and efficient in their exercise. Hydration is an important part of exercise. Most athletes who do not hydrate correctly can have their performance decreased significantly if they do not consume the correct amounts of water and electrolytes that their body requires. Additionally, sometimes excess dehydration can lead to severe life threatening conditions, and this why it is important to constantly monitor how much water the athlete's body is loosing over a period of time. At the present time, there are no other devices that give an accurate reading of the dehydration levels the body when in exercise. Although other companies have created other prototypes that measure dehydration levels, their design features are not adequate for use by an athlete. On the contrary, the Hydraband is light and has several practical attributes that make it perfect for any sport at any time.
Device Design
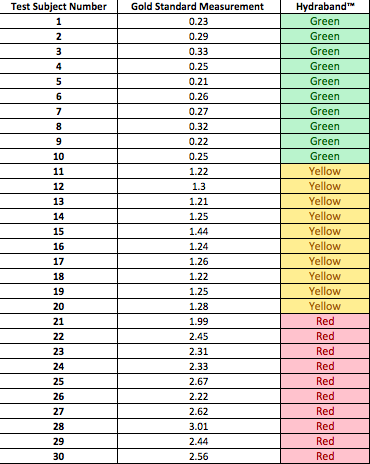
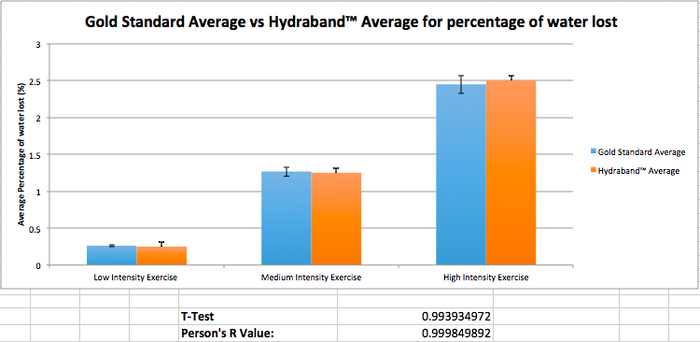
Inferential StatisticsIn the table below, the readings given by the Hydraband are given in terms of the color that was shown in the device when the test subject was perfroming the physical activity. It is important to highlight that the ranges for each color are as follows: Green: 0%-0.5% water loss. Yellow: 0.5%-2% water loss. Red: 2%-3% water loss. The gold standard test that was carried out to test the validity of the hydraband was a urine test to examine the percent of water lost by the test subjects' bodies and the concentration of several ions in the urine samples.
Graph
|
|||||||

