BME100 f2014:Group12 L2
| Home People Lab Write-Up 1 | Lab Write-Up 2 | Lab Write-Up 3 Lab Write-Up 4 | Lab Write-Up 5 | Lab Write-Up 6 Course Logistics For Instructors Photos Wiki Editing Help | |||||||
|
OUR TEAM
LAB 2 WRITE-UPDescriptive Statistics
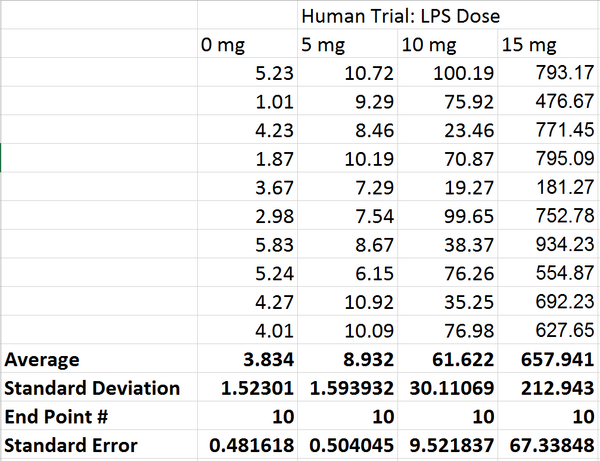
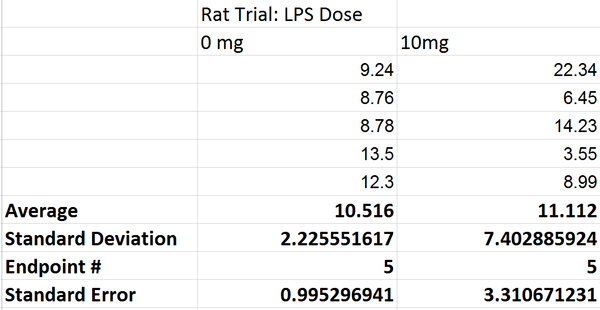
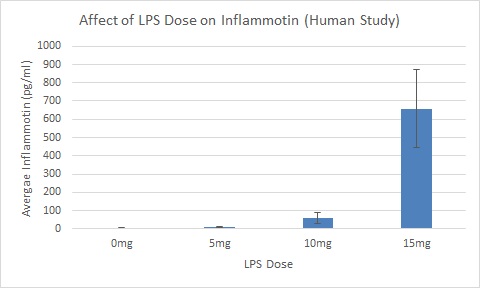
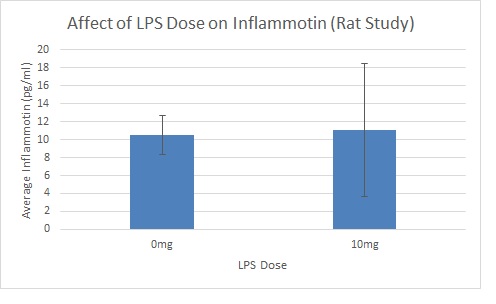
ResultsExperiment 1 Experiment 2
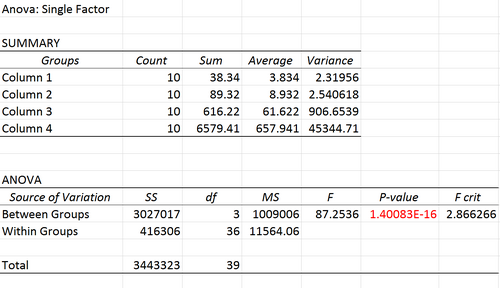
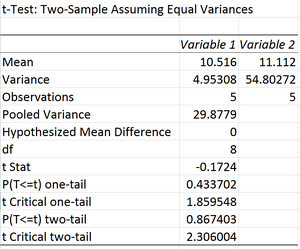
AnalysisExperiment 1 A one-way ANOVA test is used to investigate differences among several groups. In the case of the Human trial, this test is required because of the existence of 4 separate groups of data. According to the results of the one-way ANOVA test,since the p-value (1.40083E-16) is less than 0.05, there is a significant difference between the four groups. This is because the amount of LPS dose has a significant effect on the amount of Inflammotin produced in the patients. Experiment 2 The T-Test is used to investigate the differences among just two groups. In the Rat trial there were only two different levels of doses. The T-Test shows us that there is no real significant difference between the two groups due to the p-value being less than 0.05. This is due to the LPS having real no real effect on the rats.
Summary/DiscussionThe purpose of the experiment was to determine whether or not there was any effect of LPS on Inflammotin in rats or humans. For the human study, LPS doses 0, 5, 10, and 15mg’s were the independent variable while the dependent variable was the Inflammotin produced by individuals. Upon analyzing the affects of the LPS dose on inflammation for humans, when the dose of LPS is raised, the Inflammotin produced increases drastically. When the LPS dose was at 0mg, the average Inflammotin produced was 3.834pg/ml, at 5mg, 8.932pg/ml, at 10 mg, 61.622pg/ml, and at 15mg, 657.94pg/ml. The standard deviation when the LPS dose was at 0mg, was 1.523pg/ml, at 5mg, 1.594pg/ml, at 10 mg, 30.111pg/ml, and at 15mg, 212.943pg/ml. For the Rat study, only two LPS doses were tested: 0mg and 10 mg. The average Inflammotin produced by the rats did have a severe difference when the doses of LPS were changed. At 0 mg, the rats produced Inflammotin at an average of 10.516 pg/ml and at 10 mg, the rats produced Inflammotin at an average of 11.112 pg/ml. The standard deviation at 0 mg was 2.226 pg/ml and 7.403 pg/ml at 10 mg. An ANOVA test was used to investigate the differences among 4 separate groups of data. According to the results of the one-way Anova test, the p-value was 1.4E-16. Because the p-value is less than 0.05, there is a significant difference between the four groups, concluding that the different LPS dose amounts have significant effects on the Inflammotin produced in humans. A T-Test was used to investigate the differences in Inflammotin produced because there were only two groups being compared. The p-value was 0.4. Because this value is more that 0.05, there is no real significant difference between the compared groups. This concludes that there is no real affect of LPS on rats. |
|||||||

