BME100 f2014:Group11 L3

From OpenWetWare
Jump to navigationJump to search
BME 100 Fall 2014 Home
People
Lab Write-Up 1 | Lab Write-Up 2 | Lab Write-Up 3
Lab Write-Up 4 | Lab Write-Up 5 | Lab Write-Up 6
Course Logistics For Instructors
Photos
Wiki Editing Help


OUR TEAM

Name: Aliya Yano
Name: Carlo Cabanes
Name: Breanna Corrigan
Name: Mohammed Almaimani
Name: Julian Lopez

LAB 3A WRITE-UP

Descriptive Statistics


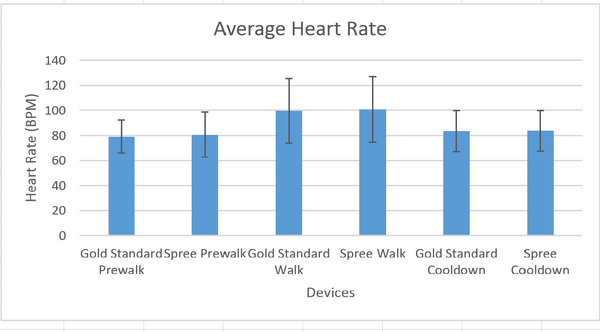
Heart Rate

Heart Rate Average Standard Deviation Standard Error
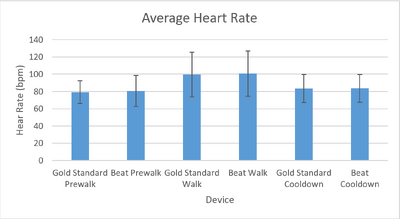
Gold Standard: Pre-walk 79.22580645 13.13393821 9.287096774
Spree: Pre-walk 80.65612536 17.92082562 12.67193732
Gold Standard: Walk 99.64516129 25.70675298 18.17741935
Spree: Walk 100.614981 26.25842375 18.5675095
Gold Standard: Cooldown 83.47870968 16.49064253 11.66064516
Spree: Cooldown 83.69305983 16.19765273 11.45347009


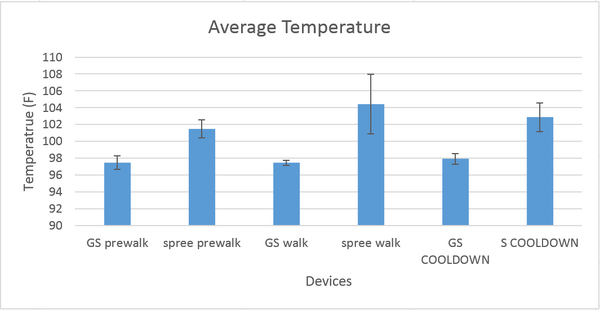
Temperature

Temperature Average Standard Deviation Standard Error
Gold Standard: Pre-walk 97.48096774 0.791275298 0.559516129
Spree: Pre-walk 101.4727273 1.079944902 0.763636364
Gold Standard: Walk 97.47672043 0.295198073 0.208736559
Spree: Walk 104.4292929 3.52660579 2.493686869
Gold Standard: Cooldown 97.916 0.610940259 0.432
Spree: Cooldown 102.8525904 1.721386831 1.217204301


Results

Heart Rate
Heart Rate Graph

Temperature
Description of image


Analysis


Heart Rate
For the experiment conducted comparing the Spree headband and a blood pressure monitor that also took heart rate readings, a T-test was used to analyze the data.This test was chosen because only two groups of data were being compared-- that of the Spree and the Golden Standard. The t-test was paired because the patient used to find both sets of data was the same. A test to find the Pearson's r-value of the data was also conducted
The p-value found in the t-test was 0.345106583. This is not smaller than 0.05; therefore, there is no significant difference in the data.
The Pearson's r-value found was 0.66110007. This suggests that there is a slight, positive linear correlation.
Description of image

Temperature
A paired T-test was used again to analyze the temperature data. This test was chosen because only two groups of data were being compared and the subject used to find both set was the same. A test to find the Pearson's r-value of the data was also conducted
The p-value found in the t-test was 8.79464E-10. This is much smaller than .05 and therefore this data has a significant difference.
The Pearsons r-value found was 0.887885479. This suggests an almost linear relationship as well as a positive correlation.
Description of image


Summary/Discussion

In this experiment the Spree headband was compared to other devices (gold standard) in reading both the heart rate and temperature of a subject. Based on the data collected, the Spree headband was much more accurate at measuring heart rate than measuring temperature. The t-test conducted for both sets of data found a p-value of 0.345106583 for heart rate and 8.79464E-10 for temperature. This shows that there was no significant difference in the data of the heart rate, but there was a significant difference in temperature. The inaccuracy of the Spree headband could be caused by the method used to find the temperature. Taking temperature externally is not very reliable; but there are instruments used by some doctors that take temperature readings from the forehead. Also, the fact that the Spree app does not give you an actual temperature, only a scale reading, does not help to improve the accuracy. Some possible remedies for this would be to give an actual temperature reading, and perhaps use more sensitive technology to get the readings, or move the Spree device so it is worn in an area that could give a better reading such as under the arm.


LAB 3B WRITE-UP

Target Population and Need

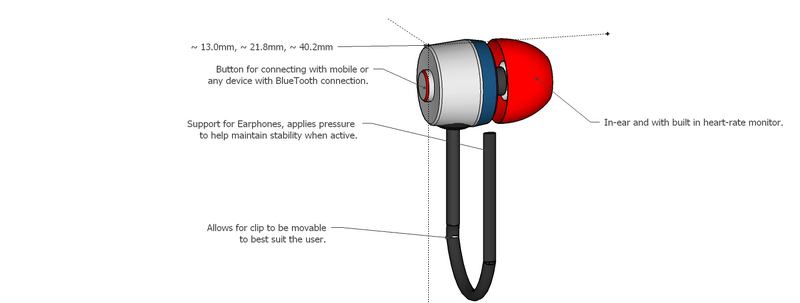
The target population for our device,TurnUp headphones, is mainly young athletes due to its unique specifications. It is able to measure heart rate and temperature but it also has settings that allow you to listen to your own heart beat as well as match songs to your heart rate. For example, if your working out and your heart rate is elevated, it will automatically play songs that have fast beats to get you pumped up. All of these setting can be controlled on your phone by using the TurnUp app.By using both the app and the headphones you can accurately measure, and record your workouts.


Device Design

Description of image


Inferential Statistics


Temperature Results
Description of image
Temperature Analysis

Description of image

Heart Rate Results

Description of image

Heart Rate Analysis
Description of image

Graph

Description of image

Description of image