BME100 f2014:Group10 L6
| Home People Lab Write-Up 1 | Lab Write-Up 2 | Lab Write-Up 3 Lab Write-Up 4 | Lab Write-Up 5 | Lab Write-Up 6 Course Logistics For Instructors Photos Wiki Editing Help | ||||||
|
OUR COMPANY
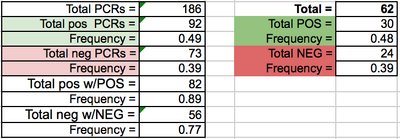
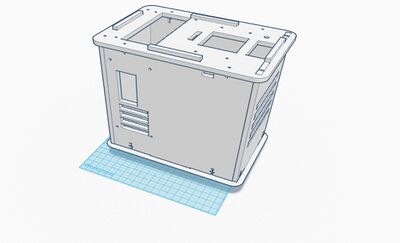
EDU PCR LAB 6 WRITE-UPBayesian StatisticsOverview of the Original Diagnosis System The BME class tested 68 patients for a disease-associated SNP. 34 teams of 6 students each worked to diagnose the patients. Each team was assigned two patients to test for the designated SNP. 3 replicates were tested per patient to decrease error from contamination of samples and natural sample variation. Each sample was mixed with green fluorescent protein, which marked the concentration of SNP positive DNA within the sample. The patient samples were each compared to a positive and negative control, which was tested using the same method. The samples were mixed with the GFP mixture. 80 μL drops of the mixture were then dropped onto slides. Images were then captured of the drops while they were in complete darkness so the fluorescence could be captured. These images were then analyzed with ImageJ software to determine the amount of green in the image. Solutions of a known DNA concentration were run through the ImageJ software to determine a calibration curve, which was then used to determine the DNA concentration of the patient samples. 3 drop images were used for the ImageJ calculations per PCR sample to reduce error. These concentration values allowed the researchers to determine which patients tested positive for the disease. These values are representative of the final values found by the BME100 class. What Bayes Statistics Imply about This Diagnostic Approach The Bayesian statistics values for calculations 1 and 2 imply that the PCR replicates are reliable for concluding whether or not a patient has the disease SNP. The Bayes values were both moderately close to 1.00 (100%). The Bayes values could have been negatively effected by various factors. The PCR tubes could have been switched during testing through poor labeling practices or communication. The Bayes values could also have been effected by the deterioration of GFP solution when exposed to light. Other error could have been caused because of the differences between cameras used, which would express the fluorescence differently. Calculations 3 and 4 imply that The PCR reliability for prediction of the disease is moderate to low, because the Bayes values are close to 50%. Computer-Aided DesignTinkerCAD Our Design
Feature 1: Consumables KitThe consumables in our kit will be packaged in single-use kits to eliminate waste and streamline the process. The kits will contain 16 PCR tubes sectioned in 4 strips of 4, 16 primer tubes, 16 PCR mix tubes, labels for the tubes to eliminate labeling errors, 16 light-tight tubes of SYBR GREEN and 64 micropipettor tips. This individual packaging will allow for ease of ordering in a lab setting with limited funding or in settings when simplicity is important. The individual sectioning of the SYBR GREEN will help eliminate issues with light contamination of the fluorescent dye. Feature 2: Hardware - PCR Machine & FluorimeterThe PCR machine will, as previously stated, be similar to the OpenPCR machine with slight changes to the lid structure. The fluorimeter will contain a more supportive stand for the camera, and will also have a flap at the front of the box to allow the shutter button to be pushed with a minimum amount of light contamination. One of the main issues with the fluorimeter set up was that the stand for the iPhone did not support it very well, and so if the camera button was pressed with too much force the iPhone would move. A better set up will include a stand with an adjustable clamp to allow for less movement of the iPhone. The bottom of the stand will also have gripping material so that the stand itself does not move when the button is pushed. This will allow for more continuity in the images.
| ||||||


