BME100 f2014:Group10 L3
| Home People Lab Write-Up 1 | Lab Write-Up 2 | Lab Write-Up 3 Lab Write-Up 4 | Lab Write-Up 5 | Lab Write-Up 6 Course Logistics For Instructors Photos Wiki Editing Help | |||||||||||||||||||||||||||||||||||||||||||||||||||||||||||||||||||||||||||||||||||||||||||||||||||||||||||||||||||||||||||||||||||||||||||||||||
|
OUR TEAM
LAB 3A WRITE-UPDescriptive StatisticsTemperature
Heart Rate
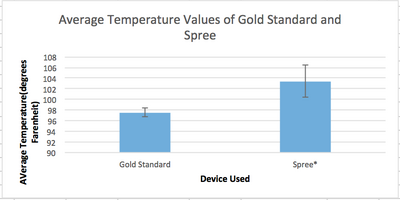
ResultsFigure 1. Temperature
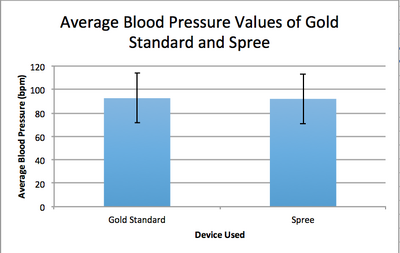
Figure 2. Blood Pressure
AnalysisCorrelation Coefficient
2-Tailed t-test
Summary/DiscussionBased on the inferential statistics it can be concluded that the temperature measurement function of the Spree device does not provide reliable measurements. The blood pressure meter is fairly accurate, and can be used to adequately measure blood pressure. The main design flaws of the Spree exist in the method by which temperature is measured. The device is susceptible to temperature changes caused by perspiration, which aims to cool the skin. The device also cools slowly, causing elevated temperature measurements after physical activity has ceased. Another design flaw is caused by the short range of the device, which means that the user must keep their phone within five meters of the device at all times. This removes any practical usage of the device by athletic programs during workouts. The device would be improved by a rebranding of the temperature sensor as a temperature guide, since it does not accurately measure temperature. An increased range of the device would also be an improvement so that athletes could monitor their heart rates while doing speed workouts or longer intervals where holding a cell phone is not always convenient.
LAB 3B WRITE-UPTarget Population and NeedThe device is targeted to athletes who need to know how to replenish the nutrients their body is losing through sweat. Athletes often either over-saturate their body with electrolytes through overuse of sports drinks or flush the salts from their bodies with too much water. Marathoners are especially susceptible because they often use electrolyte gels or chews throughout their long runs and can sometimes over-saturate their body with electrolytes because of their heavy sweat rate. This glove provides an easy way to track electrolyte secretion, and can tell the user if their electrolyte levels are either too high or too low. This allows the user to make an educated choice about their hydration methods and choose whether to drink water or a sports drink. The device also measures blood pressure so the athlete can also know pulse rate during exercise. The blood pressure meter measures pulse from the inside of the wrist and around the ring finger on the left hand.
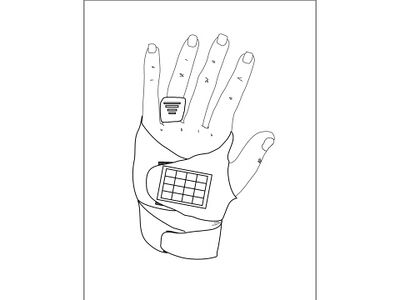
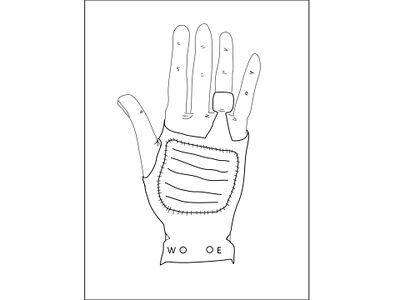
Device DesignSudor (Back of Hand) Around the finger blood pressure monitor -The bars show the user the range of their blood pressure. The more bars that are filled in, the higher the blood pressure. -Heart rate can also be monitored through the Sudor app and gives an accurate numerical reading; however, if the user does not have their phone nearby, the Sudor can give them accurate warnings based on their blood pressure levels. Sweat absorbent pad for analyzing Sodium Chloride concentration -Can be removed and cleaned between uses. -Indicates if the user needs to consume more water due to high NaCl levels, or if they need to consume more electrolytes due to a low concentration of NaCl Analysis comes from wiping the pad across the forehead (or another region with sweat droplets). Two adjustable, velcro regions for putting on/use -Can be adjusted for comfort. -Lower velcro strap needs to be snug since it also has a blood pressure monitor. Sudor (Palm of Hand) Around the Finger blood pressure monitor -Outside is made of a stretchy, comfortable material for maximum comfort and can be adjusted for various hand sizes. -Blood pressure risk levels shown on the back of the hand. Palm Grip -This material provides the user with padding on the palm of the hand and allows the device to be worn while using weights, using hands, etc. -Material is made from a "grippy" material to prevent slipping. Indicators for need for Hydration or Electrolytes -Much like the blood pressure reader, accurate results can be seen in the Sudor app, but if the user is not near their phone the lights for Water (W) and Electrolytes (E) will light up if the user is low in either. If the user is dangerously low, the Sudor will alert them with beeps. Around the Wrist blood pressure monitor -This is a second blood pressure monitor to help ensure accuracy of the readings. It needs to be snug and comfortable around the wrist of the user to give accurate results. These can be read in the app or monitored on the Sudor glove.
Inferential Statistics
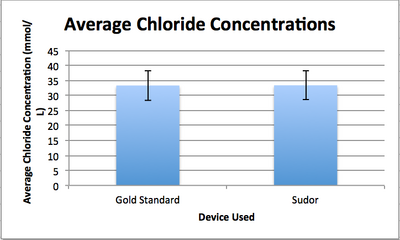
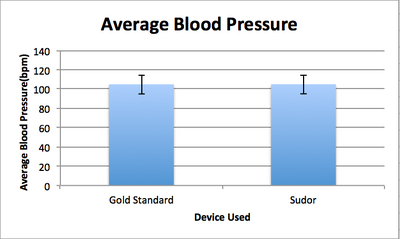
Based on the tests run for both sweat concentration and blood pressure, we can determine that the differences in the Gold Standard device and our device, Sudor, are not significant. The lack of significant difference shows that our device is accurate at measuring what we claim to be measuring when compared to devices that have been proven accurate.
Graph
|
|||||||||||||||||||||||||||||||||||||||||||||||||||||||||||||||||||||||||||||||||||||||||||||||||||||||||||||||||||||||||||||||||||||||||||||||||

