BE.109:Protein engineering/Assessing beta-galactosidase
Introduction
Cells can be considered miniature machines. They use energy to make things, record events, move around, and modify their environment. They differ from standard, mechanical machines in ways that will be further explored in the BE.109:Systems engineering experimental module, but for today consider the remarkable and useful fact that you’re working with a protein-making factory. Under the right conditions, the majority of each cell’s protein output can be the protein you’re most interested in. Though each cell is only microns in size, it’s easy to grow lots of them to yield microgram quantities of protein. Most astonishing of all is the ease with which experimental conditions can be changed to affect the protein output in rational and defined ways. The protein of interest can be turned on or off, modified or not. You did this when you added IPTG with or without an unnatural amino acid to your growth media. Today you will assess the consequences of these manipulations.
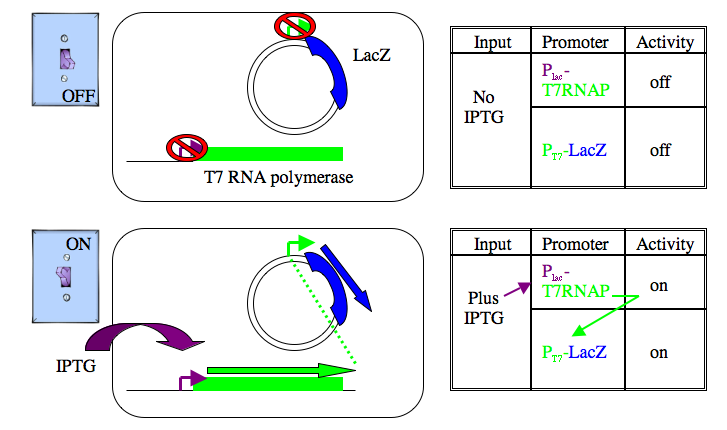
The cells you are using carry a plasmid that expresses beta-galactosidase when IPTG is added to the growth media. This expression method was originally described in 1986 (Studier and Moffatt J. Mol. Biol. Volume 189 (1): 113-130 pubmed) and then commercialized by a company called Novagen. Two specialized components are used. First is an expression plasmid in which the gene of interest, in this case the LacZ gene that encodes beta-galactosidase, is downstream of a special bacterial promoter. The promoter is not normally active since it’s recognized and used only by an RNA polymerase from the T7 bacteriophage. The gene for the T7 RNA polymerase has been added to the genome of the cells you’re using. Ironically enough, it’s the promoter from the LacZ gene that’s regulating the T7 RNA polymerase expression. Without inducer, the LacZ promoter is off, so there is no T7 RNA polymerase made and so no LacZ is expressed from the plasmid. With IPTG, the lacZ promoter is de-repressed, leading to expression of the T7 RNA polymerase, which transcribes lots of LacZ, and voila…lots of beta-galactosidase. High levels of expression can be expected since the T7 RNA polymerase promoter is strong and each cell maintains many copies of the expression plasmid.
Methods for protein overexpression are of more than academic interest since a number of human diseases arise from defects in protein production. Type I diabetes, for example, occurs when pancreatic cells are unable to make insulin. Diabetic patients must regularly treat themselves with shots of insulin to provide the missing protein. Until the 1970s, insulin was isolated from slaughtered pigs (the pig and human versions of this protein differ by only one amino acid). This method for insulin production was laborious, inefficient, and unreliable. One of the earliest examples of DNA engineering came in the 1970s when the human insulin gene was inserted into a bacterial expression vector, allowing the human gene to be expressed by the bacteria. Now most diabetics use insulin purified from such over-producing bacteria.
Today you will assess the over-production and modification of beta-galactosidase in the three samples you induced last time (no IPTG, plus IPTG, plus IPTG and plus some unnatural amino acid). First, you will perform a beta-galactosidase assay to compare the enzyme activity in these cells. This assay will be familiar to you from last time, though you’ll see there are some modifications that must be made to the protocol and calculations when whole cells are used instead of purified proteins. Second, you will examine the protein expression profile in each of your samples using an acrylamide gel to separate proteins in a way similar to the way agarose gels separate DNA. Finally, you harvest some cells to store for next time when you will try to purify the beta-galactosidase enzyme.
Protocol
Before you start any of the experiments today, you must first determine how many cells you have in each of your samples. Transfer 0.5 ml to plastic cuvettes and measure the OD600 of each, blanking the spectrophotometer with water or M9, then convert the optical density to a concentration using the approximation that 1 OD600 is ~1x10⁹ cells/ml.
| Sample | OD600 | cells/ml |
|---|---|---|
| no IPTG | ||
| plus IPTG | ||
| plus IPTG plus aa |
Part 1: Protein Gel (SDS-PAGE)
There are some important differences in protein and DNA gel electrophoresis. One thing you’ll notice right away is that the gel itself is different. DNA molecules are typically separated thorough an agarose matrix where as acrylamide is used for proteins. Both are porous sieves that retard molecules based on their length, with smaller molecules moving through the matrix faster than longer molecules. Agarose gels are run horizontally and acrylamide gels are set in the tank vertically but gravity has nothing to do with either separation. Electrical poles draw the charged molecules through the matrix. Unlike DNA, proteins do not have a uniform charge so before electrophoresis they are coated with a charged molecule (called SDS) to add negative charge proportional to their length. You could expect proteins of identical length but folded into different shapes to separate differently (not the desired outcome) so proteins are also unfolded before they are loaded on a protein gel. This is done by boiling them in the presence of a reducing agent, breaking disulfide bridges and denaturing the protein. The last notable difference in DNA and protein electrophoresis is the visualization techniques used to find the molecules once they’ve passed through the gel. Recall that DNA was visualized with Ethidium Bromide, an intercalating dye that changes its fluorescence when bound to DNA. Proteins can be detected with Coomassie stain, which detects abundant proteins in the gel, turning them blue. Other more sensitive techniques are available for staining protein gels (for example silver stain). The proteins can also be transferred from the gel to a membrane and probed with an antibody specific to a protein of interest. This last technique is called a Western blot.
- Move 1 ml of each culture to an eppendorf tube.
- Spin the samples in microfuge for 1 minute at 13,000 RPM.
- Aspirate the supernatant, put on gloves and resuspend the pellet in 100 μl of “sample buffer” for each 1 OD600 of cells (for example, 64 μl sample buffer added to 0.64 OD of cells). Sample Buffer contains glycerol to help your samples sink into the wells of the gel, SDS to coat amino acids with negative charge, BME to reduce disulfide bonds, and bromophenol blue to track the migration of the smallest proteins through the gel.
- Boil the eppendorf tubes with lid locks for 5 minutes. You have been given a 10 μl aliquot of a molecular weight marker. Don't forget to boil it too!
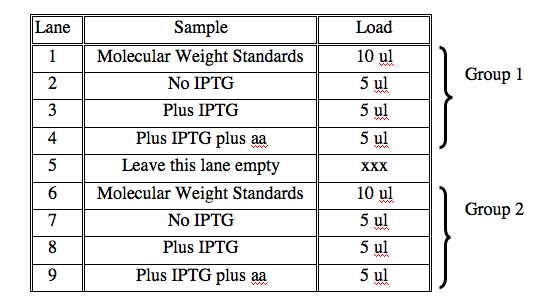
- Time to load the gels. Two groups will share each gel. Put on gloves, then load 5 μl of each sample in the order below. Once you have loaded a sample from one tube, move it to a different row in your eppendorf rack. This will help you keep track of which samples you have loaded.
- Once all the samples are loaded, turn on the power and run the gel at 200 V. The molecular weight standards are pre-stained and will separate as the gel runs. The gel should take approximately one hour to run. During that hour, you should perform the beta-galactosidase assays described below.
- When the gel has run, an instructor will show you how to disassemble the apparatus, and move the gel to Coomassie stain. The gels will be stained for at least one hour and then destained (to remove random blue stain from the pores of the gel) overnight.
Part 2: Beta-galactosidase assay
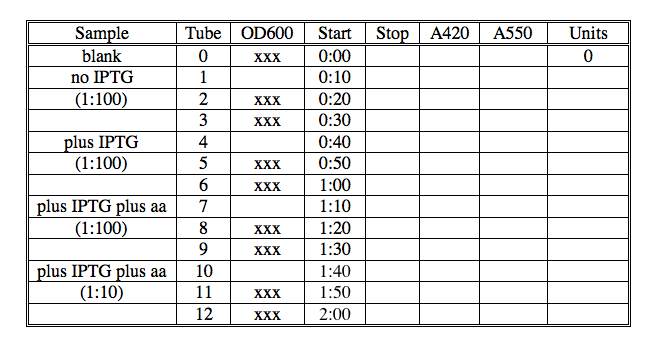
With this assay you will determine the amount of beta-galactosidase activity associated with each sample of cells. You will perform assays of each sample in triplicate to gain some confidence in the values you measure. A table is included here to help you organize your assay, but you can make one of your own if you prefer.
- Make 1 ml of a 1:10 dilution of each cell sample, using Zbuffer-BME as the diluent, then use 100 ul of this dilution to make another 1:10, for a final concentration of 1:100.
- Add 400 μl of Zbuffer-BME to 13 eppendorf tubes labeled 0-12.
- Add 100 μl of the appropriate cell dilution to each tube (1:100 of no IPTG in tubes 1-3 etc). See chart below for guidance. Add 100 ul of Zbuffer-BME to tube 0, to serve as your blank.
- Next you will lyse the cells by add 20 μl of 0.1% SDS to each eppendorf.
- To better lyse the cells, you should also add 30 μl of chloroform (CHCl3) to each tube. Do this in the hood since chloroform is volatile and toxic. You will need to hold the pipet tip close to the eppendorf as you move between the chloroform stock bottle and your eppendorfs since chloroform has a low surface tension and will drip from you pipetmen. Be sure to dispose of your pipet tips in the chloroform waste container located on the right side of the hood.
- To really really lyse the cells, vortex the tubes for 10 seconds each. You should time these precisely since you want the replicates to be treated as identically as possible.
- Start the reactions by adding 100 μl of ONPG to each tube at 10 second intervals, including your blank.
- Stop the reactions by adding 250 μl of Na2CO3 to each tube at 10 second intervals once sufficient yellow color has developed. “Sufficient” is defined as yellow enough to give a reliable reading in the spectrophotometer, best between 0.3 and 1.0. Be sure to note the time you are stopping the reactions. Also be sure to remember that adding the Na2CO3 makes the reactions more yellow.
- When all your samples have been stopped, add 250 μl of Na2CO3 to the blank and spin all the tubes in the microfuge for 1 minute at 13,000 RPM to pellet any cell debris.
- Move 0.5 ml of each reaction to plastic cuvettes and read the absorbance at 420nm. These values reflect the amount of yellow color in each tube.
- Read the absorbance of each at 550 nm. These values reflect the amount of cell debris and differences in the plastic cuvettes themselves.
- Calculate the beta-galactosidase activity in each sample according to the following formula:
- Beta-gal Units = Abs at 420 minus (1.75 times Abs at 550nm) all divided by the product of time in minutes, volume of cells (from original culture) in ml and OD600 (of the original culture), then all times 1000.
- Dispose of your samples properly. Place all cuvettes and tubes in the chloroform waste container in the hood.
Part 3: Harvest Cells for Protein Purification
Next time you will purify the beta-galactosidase from your induced samples. Store these cells by moving 1 OD600 from the “plus IPTG” sample and 1 OD600 from the “plus IPTG plus aa” sample to eppendorf tubes. Microfuge these tubes for 1 minute, remove the supernatant and freeze the pellets at –20°C until next time.
DONE!
For Next Time
- Protein gels are often called “SDS-PAGE” which stands for “SDS-polyacrylamide gel electrophoresis.” Please re-read the description of protein gels in the introduction to today’s experiment then define in a sentence or two the reasons for the “SDS” “polyacrylamide gel” and “electrophoresis” parts of the name.
- Sketch what you expect your protein gel to look like if the addition of IPTG causes 50% of the protein content to be beta-galactosidase.
- Compare the beta-galactosidase assay we performed today with the one described on OWW at Beta-Galactosidase Assay (A better Miller). List at least three experimental differences and suggest what these changes might give rise to.
- Prepare a table of beta-galactosidase units associated with each sample, showing the values for each replicate and the average. Are you showing the units of the 1:10 dilution of cells or the cells themselves (you should do the latter)? What do the units tell you about the induction? What can you tell about the effect of the unnatural amino acid on the enzyme’s activity?
Reagents List
Sample buffer
- 60 mM Tris, pH 6.8
- 2% SDS
- 1% glycerol
- 0.01% bromphenol blue
- 5% beta-mercaptoethanol
Running buffer
- 25 mM Tris
- 192 mM Glycine
- 0.1% SDS
Coomassie stain (1 liter?)
- 0.25 g Coomassie Brilliant Blue
- 45% methanol (v/v)
- 10% acetic acid (v/v)
- 45% MilliQ H20 (v/v)
Destain buffer
- 45% methanol
- 7.5% acetic acid
- 47.5% MilliQ H20


