Austindias Week 14/15
Background on Tai et al. (2007)
This study evaluated the acclimation of Saccharomyces cerevisiae to low temperature using a two nutrient chemostat method. Prior to this paper the authors mention the common use of batch cultures. The authors suggest the superiority of the two nutrient chemostat in comparison to the batch cultures utilized in previous studies because of its ability to separate the effects of growth rate and temperature on gene expression at low temperatures. The main findings of the Tai et al. (2007) were:
- It is not possible to only change a single parameter without an effect on any others, even using the chemostat culture approach
- The only indistinguishable group of genes that was similarly regulated in low-temperature chemostats and batch culture studies on low-temperature adaptation were related to lipid metabolism
- Trehalose is not involved in steady-state low-temperature adaptation
- Transcript levels of environmental stress response genes were reduced at 12 C
- Significant differences between transcriptional response to low temperature occur between long term exposure in comparison to abrupt temperature change
- Transcriptional responses to low temperature and low specific growth rate can be separated by using chemostat cultures instead of batch cultures
- It is highly important to differentiate phases of physiological adaptation in response to environmental change
- Response to low temperatures by S. cerevisiae is not entirely dependent on changes in transcription
Purpose
The objective of this assignment was to develop a MATLAB code that could model the chemostat used in Tai et al. (2007). The previous objective was to discover paramaters from this paper that could be applied to our MATLAB model. After performing this step, our next goal was to identify the activation energy and frequency factor constant, in addition to constructing a fuction of E (efficiency) in terms of y (residual glucose).
Mathematical Reasoning: Solving for 'A' and 'B'
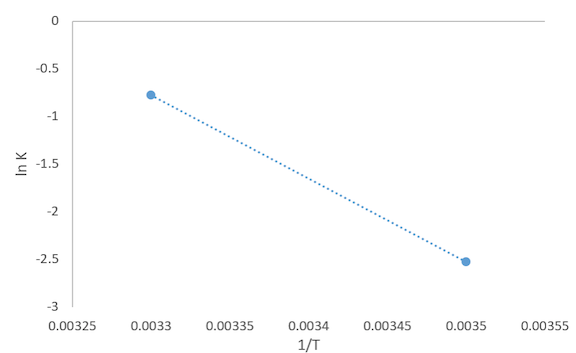
- Graphed ln K versus 1/T
- The slope of this graph was calculated to help solve for 'B'
- slope = -8400.36 = -Ea/R
- Ea = B = 69,840.59
- Used Arrhenius equation (rate = A*exp(-B/(R*T)) to solve for 'A'
- A = 4.979 x 10^11
- Solved for the rate at 15, 20, and 25 C
- 15 C
- r = (4.979 x 10^11)e^(-69840.59)/((8.314)(288.15)) = 0.1087
- 20 C
- r = (4.979 x 10^11)e^(-69840.59)/((8.314)(293.15)) = 0.17874
- 25 C
- r = (4.979 x 10^11)e^(-69840.59)/((8.314)(298.15)) = 0.289
- 15 C
Mathematical Reasoning: Investigate the glucose efficiency/waste constant
m = (y-y)/(x-x)
12 C
- m = (14.3-20)/(0.5045-16.22)
- m = 0.363
30 C
- m = (14.3-25)/(.0541-15.33)
- m = 0.7004
E = my + b
12 C
- 14.29 = (0.363)(0.5045) + b
- b = 14.107
30 C
- 14.29 = (0.7004)(0.0541) + b
- b = 14.252
Overall Equations:
12 C
E = 0.363y + 14.107
30 C
E = 0.7004y + 14.252
Results
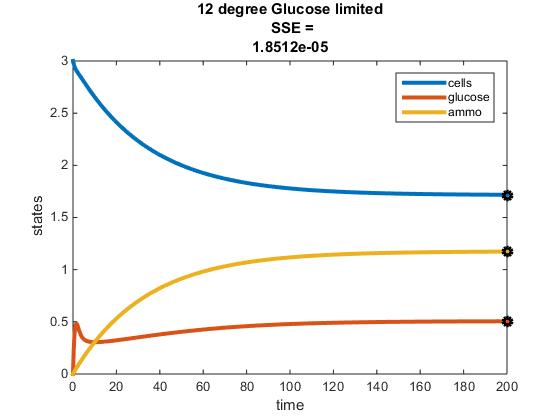
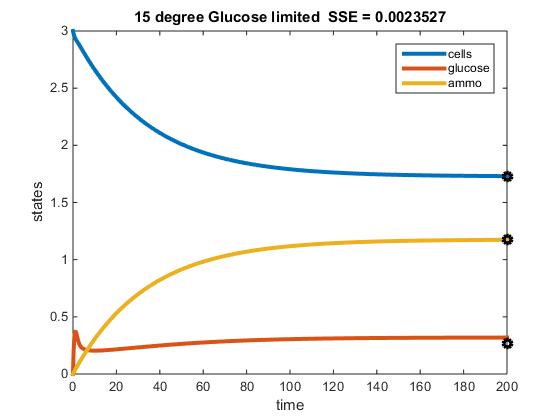
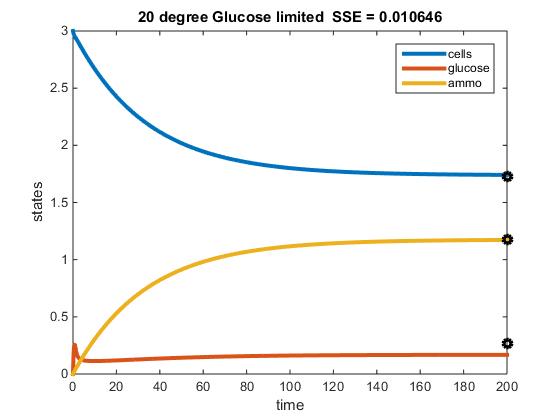
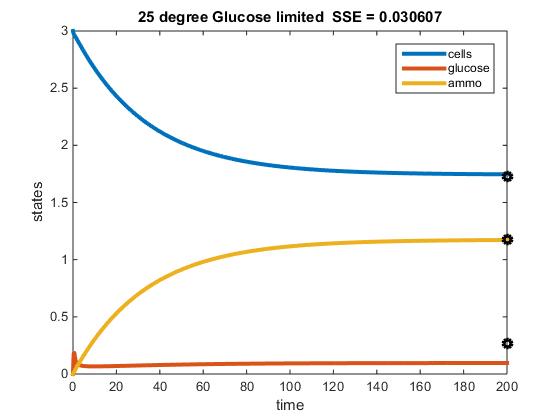
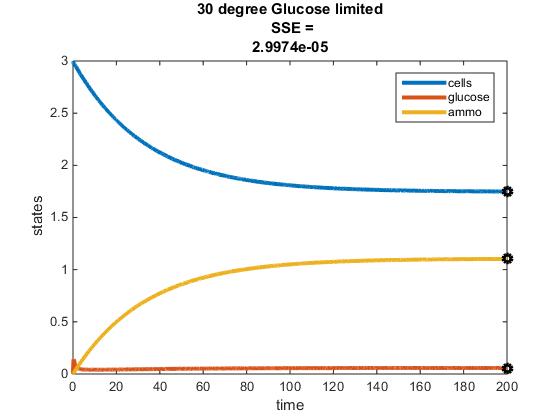
Original Modeling of Two Nutrient Chemostat:
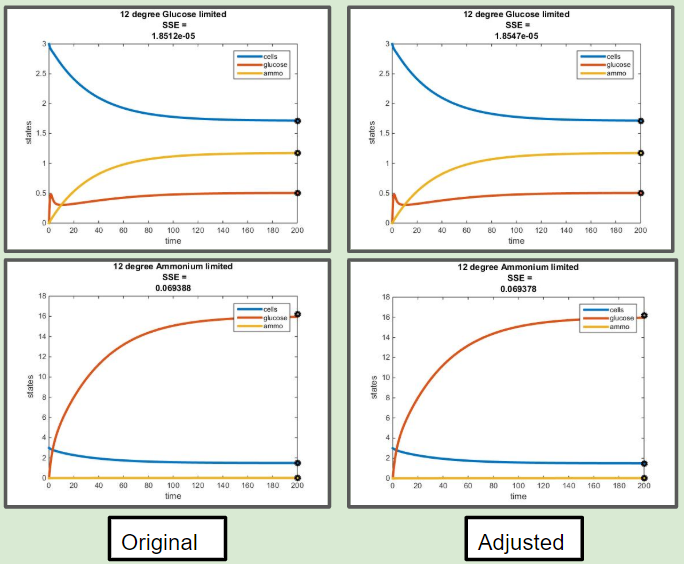
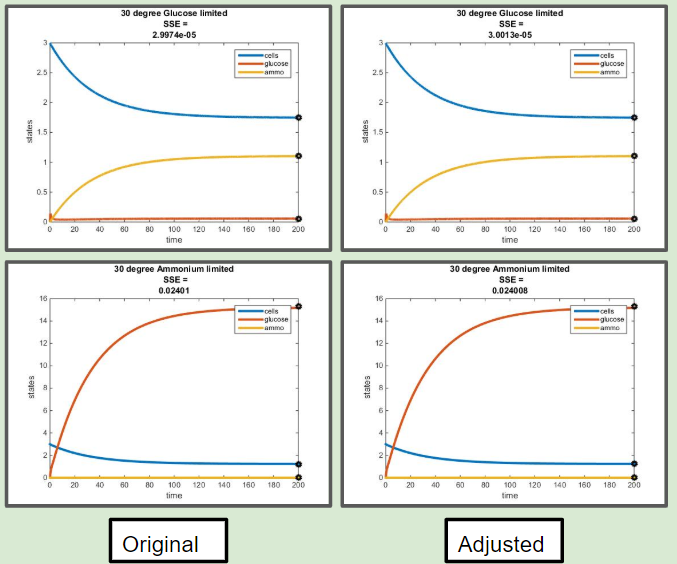
Adjusted Model for E = myEff(y) Comaprisons
Comparison of Original Efficiency Versus Efficiency as a Function of Residual Glucose at 12 C
Comparison of Original Efficiency Versus Efficiency as a Function of Residual Glucose at 30 C
MATLAB files
Final Presentation
Temperature Dependence and Nutrient Use Efficiency of Chemostat Reaction
Acknowledgments
- Met with my homework partner Sahil Patel on several occasions to work through the assignment
- Met with Edward Ryan R. Talatala once in person to help create a function of E (efficiency) in terms of y (residual glucose)
- Alison S. King Helped with inputting specific growth rate values at 15, 20, and 25 C into MATLAB model
Austindias (talk) 07:10, 9 May 2019 (PDT)
References
Activation Energy. (n.d.). Retrieved from https://www.chem.fsu.edu/chemlab/chm1046course/activation.html
Dahlquist, K. and Fitzpatrick, B. (2019). BIOL388/S19:Week 14/15. [online] openwetware.org. Available at:Week 14/15 Assignment Page [Accessed 6 May 2019].
Dias, A. (2019). BIOL388/S19:Week 14/15. [online] openwetware.org. Available at: Week 9 Assignment Page [Accessed 8 May 2019].
Tai, S. L., Boer, V. M., Daran-Lapujade, P., Walsh, M. C., de Winde, J. H., Daran, J. M., & Pronk, J. T. (2005). Two-dimensional transcriptome analysis in chemostat cultures combinatorial effects of oxygen availability and macronutrient limitation in Saccharomyces cerevisiae. Journal of Biological Chemistry, 280(1), 437-447.
Tai, S. L., Daran-Lapujade, P., Walsh, M. C., Pronk, J. T., & Daran, J. M. (2007). Acclimation of Saccharomyces cerevisiae to low temperature: a chemostat-based transcriptome analysis. Molecular Biology of the Cell, 18(12), 5100-5112.
