Austindias Week 11
Purpose
Use given parameters to discover nutrient mass and cell biomass steady states and compare with the computations of steady state values in MATLAB files chemostat_script.m and chemostat_dynamics.m
Background
- In a chemostat nutrients are fed continuously at a fixed flow rate and concentration, and effluent is extracted at a fixed flow rate.
- Concentration of mixture is uniform throughout the container--> can assume that all cells have equal access to nutrients
- The following parameters are involved with the chemostat:
- Q = volumetric inflow rate (vol/time)
- V = volume in container (vol units)
- q = Q/V --> dilution rate (1/time)
- u = feed concentration (concentration units)
- y(t) = concentration of nutrients
- V = volume of mixture in tank
- Rate of change of nutrient = inflow rate – outflow rate – rate consumed in the tank
- uses Michaelis-Mentin model of consumption
- qu = inflow rate ; independent of time
- qy(t) = outflow rate
- net growth rate depends on nutrient level and consumption model depends on the size of the population
- Equilibrium (steady state) is the state that would remain constant in time if we reached it
- x can not be equal to 0 because that would indicate the cell population is extinct
- nutrient mass y = (qK)/(r-q)
- cell biomass x = (u-y)/E
- steady state nutrient concentration is independent of the feed rate 'u', while the cell population depends linearly on 'u'.
Methods
- Plugged following parameter values into appropriate equation:
- q = 0.10 (1/hr)
- u = 5 (g/L)
- E=1.5
- r=0.8 (1/hr)
- K = 8 (g)
- To find nutrient mass I used the equation y = (qK)/(r-q)
- To find the cell biomass I used the equation x = (u-y)/E
- When assuming a 2 liter chemostat, I divided my values by 2. Considering the units for steady concentrations were in g/L, this would change to g/2L when considering a 2L chemostat.
- Next I stimulated the system dynamics using the MATLAB files and the parameters stated previously.
- I assessed whether the graphs showed the system going to steady state and if the graphs matched my findings from my initial calculations.
Results
Steady states of cell biomass and nutrient mass:
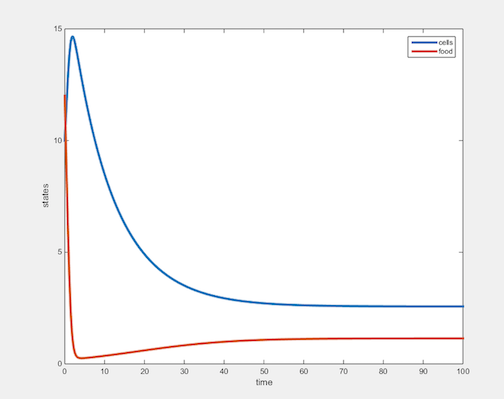
- nutrient mass = 1.14 g
- cell biomass = 2.6 g
Assuming a 2 liter chemostat, steady state concentrations of cells and nutrient:
- [nutrient] = 0.57 g/L
- [cell] = 1.3 g/L
Graph Resulting from the MATLAB Simulation
Conclusion
The graph for nutrient mass and cell biomass shows the system reaching steady state around 40 minutes. The steady states match the calculated values that I found using the equations for nutrient mass and cell biomass at steady state. Using different parameters would alter the steady state equilibrium between nutrient mass and cell biomass. The establishment of steady state confirms the objective of the chemostat and isolates the effect of temperature and growth rate on gene expression.
Acknowledgments
- Texted Leanne Kuwahara about the assignment.
- Had text conversations with my homework partner Brianna Samuels to discuss the class journal questions.
- Dr.Fitzpatrick and Dr. Dahlquist provided the files and information necessary to complete this task.
Except for what is noted above, this individual journal entry was completed by me and not copied from another source.
Austindias (talk) 18:00, 26 April 2019 (PDT)
References
Dahlquist, K. and Fitzpatrick, B. (2019). BIOL388/S19:Week 11. [online] openwetware.org. Available at:Week 11 Assignment Page [Accessed 6 Apr. 2019].
Return to Homepage Austin Dias
