Objectives
- Run fluorescence data for lysozyme at pH=4
- Create stock solutions for use on 09.27.2016
Description
Fluorescence
- Solutions made using measurements below
- Fluorescence data run every 5 minutes for 3 hours
Solutions for 09/27/2016
Solutions were added to glass test tubes, covered with foil, and placed in an oven set to 80°C for 4 hours.
Data
Fluorescence
- Solution Measurements
- Lysosome Stock Solution
- concentration = 225 μM
- Gold Stock Solution
- concentration = 3.73 mM
- Lysozyme: 0.25mM Au, 12.5μM Lysozyme, 3mL total; pH 6
- 223 μL AuCl3
- 3 μL 1M HCl
- 167 μL Lysozyme
- 2607 μL Water
- Fluorescence Summary Graphs

Figure 1 Maximum emission data in a solution of pH 6

Figure 2 Integrated fluorescence data in a solution of pH 6

Figure 3 Full emission spectra for important time points: t=0, 6, 39, 96, and 180 min.
Figure 3 Explanation
- At t=0 min, we see a max emission far to the left of the other emission spectra.
- At t=6 min, this maximum has shifted up and to the right.
- Until t=39 min, the maximum for each spectra decreases until the shown maximum.
- After t=39 min, the maximum begins increasing again.
- At t=96 min, the maximum continues to increase, but the "shoulder" seen at around 475 nm begins going away.
- t=180 shows the final full spectra obtained.
UV-vis solutions for 09.27.2016

Table 1 UV-vis solutions made for [Fructose]=.75mM
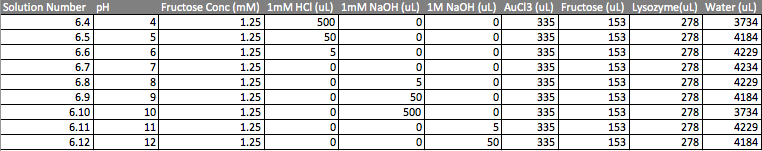
Table 2 UV-vis solutions made for [Fructose]=1.25mM
Notes
Fluorescence data taken every 3 minutes instead of every 5 minutes
|


