User:Anthony Salvagno/Notebook/Research/2010/11/03/Calibration: Analysis of Yesterday's Analysis
Quick Navigation: Pages by Category | List of All Pages | Protocols
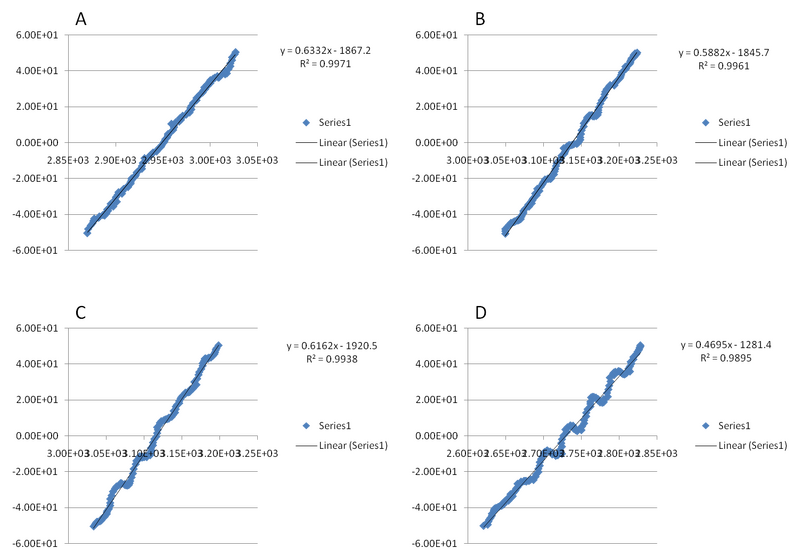
Yesterday we showed that the noise from the fan was the source of the noise. Today I'm going to get the slope of those lines to give us some information we need. I don't remember what for, but we want V/nm where V is the voltage reading in the x-direction and nm is the distance moved by the piezo.
Results

Figures A, B, and C are all from yesterday's fan/blower on/off analysis. Figure D is from 2 Fridays past with the camera fan on and the blower on full. I don't recall which A, B, C relate to the graphs I posted yesterday except that Figure A is definitely Blower Off Fan Off. There is a good chance figure B is blower on fan off and figure A is blower on fan on, with blower on being the lowered amplitude from yesterday.
From these results it looks like the average is somewhere around 0.6 V/nm. More studies will be conducted.
Also it looks like having the blower off completely may provide better results. Figures B and C look pretty periodic even though the amplitude is much decreased from figure D. Figure A looks amazing.
More Results
I had to upload to slideshare since google docs didn't work. Oh well. I scanned 6 different beads and got the above results.