Talk:20.109(S10):Testing cell viability (Day3)
T/R schedule
Staining protocol time is expected to be ~ 1 hour, leaving 25 min blocks of microscope time for each group.
Please come prepared to lab (i.e., having read the protocol), and feel free to arrive even earlier than the suggested times below.
| Microscope time | Arrival time (at latest!) | Team colour |
| 2:05-2:30 | 1:05 | Red |
| 2:30-2:55 | 1:20 | Yellow |
| 2:55-3:20 | 1:45 | Blue |
| 3:20-3:45 | 2:10 | Orange |
| 3:45-4:10 | 2:35 | Green |
| 4:10-4:35 | 3:00 | Purple |
| 4:35-5:00 | 3:25 | Pink |
| Team colour | |
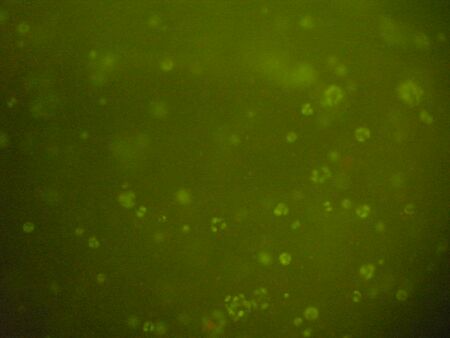
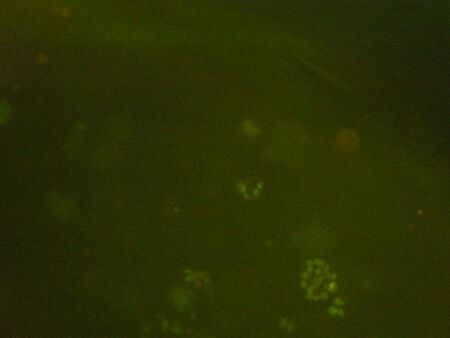
| Red (a) | Red (b) |
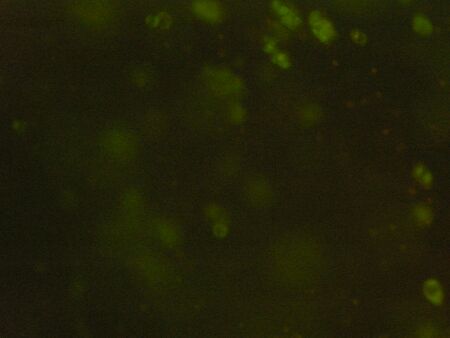
| Fluorescence Assay is used to tack and compare cell viability. At a magnification of 10X, the viability of the cells in beads without chelator (a) and with chelator (b) were relatively similar. | |
| Yellow with biological pH (7.2-7.4) | |
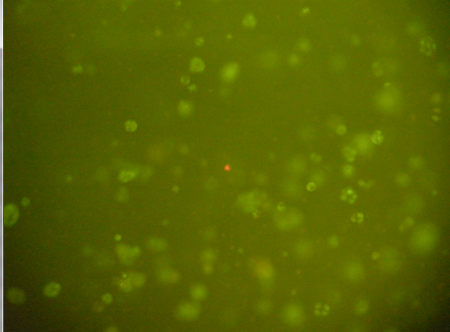
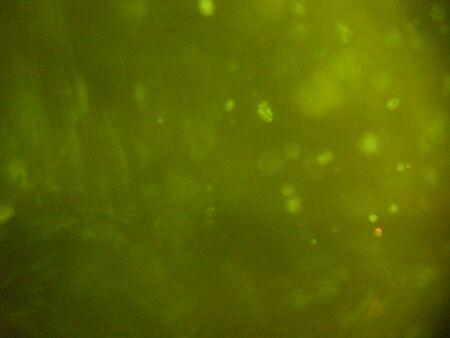
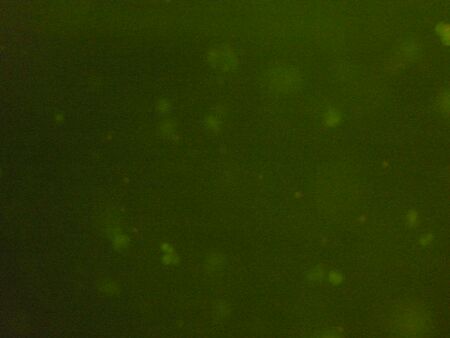
| This image was taken from the cross section of a bead at biological pH.
The concentration of cells as well as the ratio of dead (red) to live (green) cells is representative of all frames observed. The distribution of cells was uniform at different layers of the bead. | |
| Yellow with pH 8.0 | |
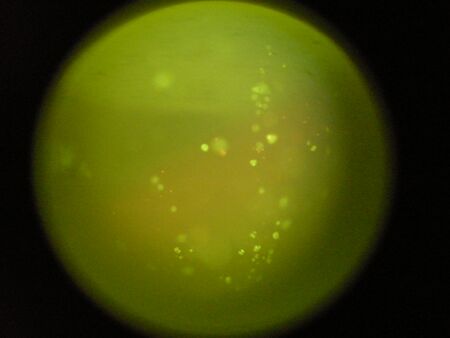
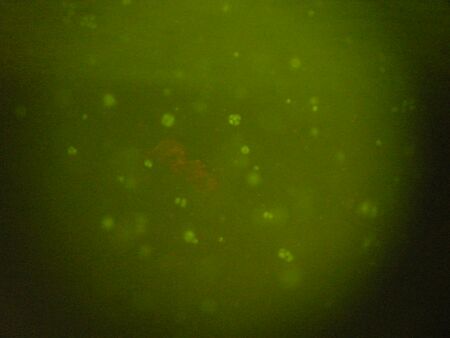
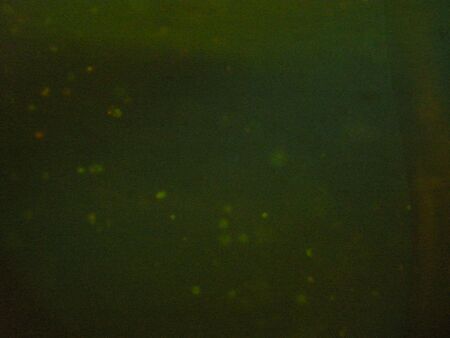
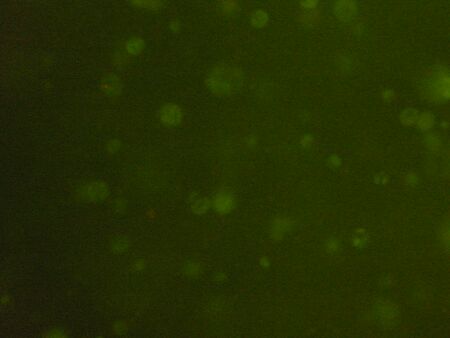
| This image was taken from the surface a bead at pH 8. The concentration of cells
as well as the ratio of dead (red) to live (green) cells is representative of all frames observed. The distribution of cells was uniform at different layers of the bead. There does not appear to be a significant difference in viability between high and low pH, but the density of cells in high pH was approximately 5 x lower than in biological pH. | |
| Blue | |
| Orange | |
| Green
File:LIVE DEAD FIGURE.pdf Sorry, I actually don't know how to upload it directly onto the page... | |
| Purple | |
| Pink |
| Start time | Team colour(s) |
| first (is the worst) | Yellow,Green,Red |
| second (is the best) | Purple,Orange, Blue |
| third (is ---) | Pink |
W/F schedule
Staining protocol time is expected to be ~ 1 hour, leaving 25 min blocks of microscope time for each group.
Please come prepared to lab (i.e., having read the protocol), and feel free to arrive even earlier than the suggested times below.
| Microscope time | Arrival time (at latest!) | Team colour |
| 2:05-2:30 | 1:05 | Orange |
| 2:30-2:55 | 1:20 | Red |
| 2:55-3:20 | 1:45 | Yellow |
| 3:20-3:45 | 2:10 | Purple |
| 3:45-4:10 | 2:35 | Pink |
| 4:10-4:35 | 3:00 | Green |
| 4:35-5:00 | 3:25 | Blue |
[[[[]]]]
| Team colour | |
| Red (a) | Red (b) |
| Fluorescence microscopy of chondrocyte cultures with different alginate cross-linking degrees. Alginate bead cross-linked with 204 mM CaCl2 (a) and 51 mM CaCl2 (b) reveals were stained differentially for viability. Green cells are living cells that were stained with SYTO 10, while red cells are dead cells stained by Ethidium. Objective magnification was 10X. | |
| Yellow (a) | Yellow (b) |
| Fluorescence microscopy images of chondrocytes cultured in alginate beads with (a) 1mg/mL chondroitin sulfate and (b) 0.1mg/mL chondroitin sulfate. Both pictures were taken at 10x magnification at the core of the alginate bead. | |
| Blue | |
| Orange File:F).pdf | |
Green 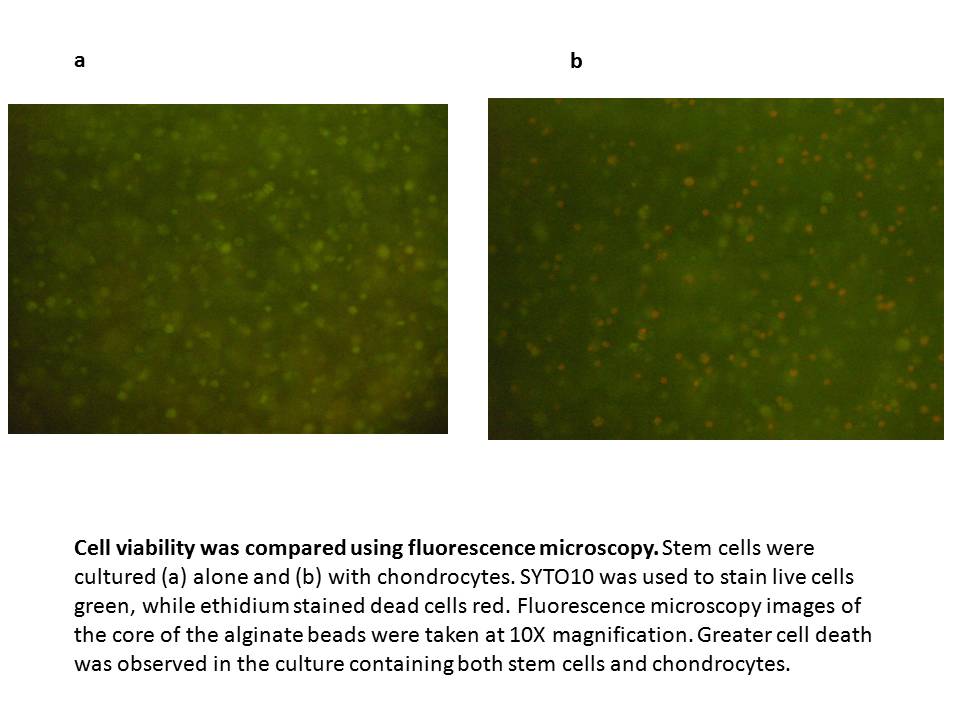
| |
| Purple (a) | Purple (b) |
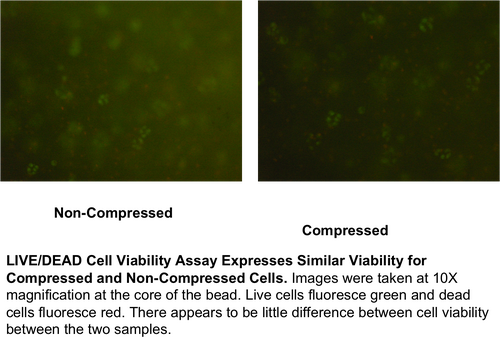
| Flourescence microscopy images of chondrocytes grown under two conditions: a) shaken for twenty minutes every day and b) not shaken at all. Pictures were taken at 10X magnification. Living cells were stained green by SYTO 10, while dead cells were stained green with SYTO 10 and red with ethidium. Living cells appeared green and red cells appeared red. Both pictures were taken at the surface of the alginate bead. | |
| Pink (a) | Pink (b) |
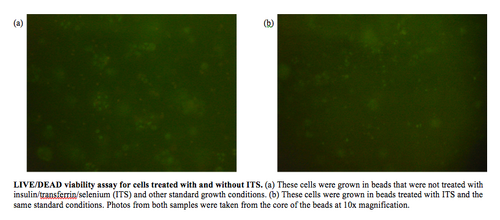
| Fluorescence microscopy of chondrocytes grown under two conditions in alginate beads: (a) with Insulin-transferin-selenium (ITS) and FCS and (b) without ITS. } | |
| Blue (a) | Blue (b) |
| Cell viability was assessed using fluorescence microscopy.The chondrocytes were grown in alginate beads at two different cncentrations and the images of the microscopy are shown: (a) 10x diluted (1.33*10^6 cells/mL) and (b) 1x diluted (1.33*10^5 cells/mL). |
