Standardized GFP quantification
Contacts
Barry Canton, Caitlin Conboy, Jason Kelly, Ania Labno, Josh Michener
Introduction
This project falls into the larger category of standardizing biological technologies and processes (see also this open project). We think that this project would benefit a number of people in the Endy lab and others.
Standardization offers many benefits when designing and characterizing engineered biological systems. While standardization can be implemented at many levels with varying levels of difficulty, a fundamental standardization is to be able to reliably quantify the number of reporter proteins per cell in a culture sample. If this quantification can be done reliably and rapidly then experimental data can be compared across experiments, instruments and labs. Ideally, a calibration curve should exist for all instruments (e.g. plate readers, flow cytometers etc.) so that the relative units on the particular machine can be related back to absolute numbers of molecules per cell.
Specifically, we are proposing to calibrate the relative measurements from plate reader and flow cytometer to GFP molecule numbers per cell. In the longer term we would like to extend this to other fluorescent reporters and a wide range of instrument settings.
An initial attempt at doing this has been undertaken to calibrate the Endy lab's plate reader GFP counts to GFP concentration. You can read about it here.
Prior Work
We can draw on a large body of work that has been done to quantify absolute numbers of molecules and to produce reproducible standards for instruments. We highlight a number of techniqes that can be leveraged to enable the standard quantification of molecule numbers.
- Protein purification techniqes
- Quantitative Western blotting and variants
- Fluorescence protein technologies
- Standardized fluorescent bead technologies
- Microscope image analysis techniques (a la Elowitz)
We have sufficient expertise in a number of these technologies to perform a standardization process on all the instruments we currently use. For example, Caitlin Conboy and Jennifer Braff have calibrated the flow cytometer fluorescence to quantitative Western data for GFP.
Approach
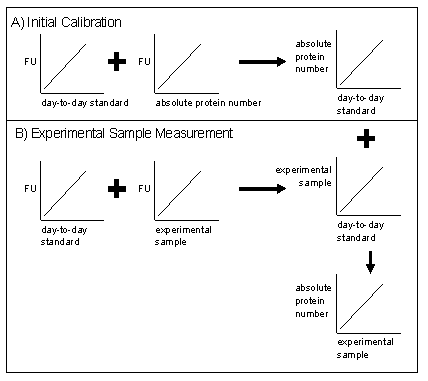
In order to quickly quantify the GFP protein level we will specify a method that requires conducting a stringent "absolute" measurement of protein levels (e.g., Q-Western) once in parallel with measurements of a "day-to-day" GFP surrogate (e.g, beads or purified GFP) on a fluorescence measuring instrument.
This "day-to-day" control can then be run in parallel with future experimental samples to account for instrument variation, etc, and allow the absolute protein level of the sample to be determined without requiring the stringent measurement to be made each time.

Plan of Action
- Decide on a gold standard measurement technique - Try a number of protein quantitation techniques (i.e Western blotting, Bradford assays etc.). Either pick the best or use a combination of methods as a gold standard method of quantifying the number of proteins per cell in a sample.
- Decide on a "day-to-day" standard - This is a standard sample that is cheap enough to be used every time a sample is tested on the measurment instrument. Its fluorescence should be very stable over time. Optimally each machine should use the same day-to-day standard but since each day-to-day standard will be related back to the gold standard this is not necessary and may be impractical. For example, purified GFP might serve as a day-to-day standard on a plate reader and fluorescent beads could be used on a flow cytometer.
- Make the gold standard measurements - Produce samples with a range of concentrations as determined by the gold standard measurement technique. Ideally these samples should originate from cells that were processed as similarly as possible to those that will be tested experimentally.
- Produce master calibration curves of gold-standards to day-to-day standards - For each instrument and for a range of instrument settings and over a number of trials, run the gold standard samples from point 3 and the day-to-day standard samples. Use this data to produce a calibration curve that relates the day-to-day standards to the gold standard data. This process is illustrated in Figure 1.A of the Figure above. Ideally, the one calibration curve would be valid for a number of instrument settings as the relationship between gold standards and day-to-day standards shouldn't be altered by small changes in instrument settings. This would of course need to be verified.
- Make these calibration curves publicly available - Anyone who uses the instrument and runs the day-to-day standards along with their own samples should be able to convert their sample values into day-to-day standard levels from that to absolute protein numbers using the master calibration curve for that instrument and setting. This process is illustrated in Figure 1.B. See an example calibration curve here.