BISC209/F13: Lab2: Difference between revisions
| Line 42: | Line 42: | ||
=='''Abundance Test 2: Enumeration of Community Soil Microorganisms by Direct Count of Microbial DNA Stained & Viewed by Fluorescence Microscopy'''== | =='''Abundance Test 2: Enumeration of Community Soil Microorganisms by Direct Count of Microbial DNA Stained & Viewed by Fluorescence Microscopy'''== | ||
You can directly count a random sample of microbes from the soil extract that you prepared last week and then extrapolate the number per gram of soil. To make the microbes easier to count, you stained the nucleic acids of your soil community microbes (not just the bacteria) with a fluorescent 4'-6-Diamidino-2-phenylindole (DAPI) DNA stain. All the microbes in a 1ml aliquot of the 1% soil extract that you prepared last week were transferred in a Poisson distribution to a small piece of filter paper. Your instructor photographed the discreet bright "spots" of fluorescent DNA in several different areas of the filter paper distribution using fluorescence microscropy. You will each count the discreet "spots" (individual microorganisms = one fluorescent genome/cell) from and perform the calculations described below to assess the total microbial concentration in this ''culture-independent'' enumeration of your soil community's microorganisms. <BR><BR> | You can directly count a random sample of microbes from the soil extract that you prepared last week and then extrapolate the number per gram of soil. To make the microbes easier to count, you stained the nucleic acids of your soil community microbes (not just the bacteria) with a fluorescent 4'-6-Diamidino-2-phenylindole (DAPI) DNA stain. All the microbes in a 1ml aliquot of the 1% soil extract that you prepared last week were transferred in a Poisson distribution to a small piece of filter paper. Your instructor photographed the discreet bright "spots" of fluorescent DNA in several different areas of the filter paper distribution using fluorescence microscropy. You will each count the discreet "spots" (individual microorganisms = one fluorescent genome/cell) from and perform the calculations described below to assess the total microbial concentration in this ''culture-independent'' enumeration of your soil community's microorganisms. <BR><BR> | ||
'''COUNTING & CALCULATIONS:'''<BR> | '''COUNTING & CALCULATIONS:'''<BR> | ||
| Line 69: | Line 47: | ||
The area of each field of view at 1000X using the Fluorescent scope is 10487 μmeters<sup>2</sup>. The area is determined for the microscope used, in our case, a NIKON 80i fluorescent microscope. The diameter of the filterable section of the borosilicate apparatus is 17 mm (8500 μmeter radius). Therefore, the area is 2.28 X 10<sup>8</sup>μmeter<sup>2</sup>. Multiply the number of microorganisms counted on the photomicrograph by a factor of 2.17X10<sup>4</sup> (2.28 X 10<sup>8</sup>μm<sup>2</sup> divided by 1.0487 x 10<sup>4</sup>μmeters<sup>2</sup>) to determine the number of organisms found in 1mL of filtrate of extract. Then correct for the 1:100 dilution factor of filtrate which is the number of organisms in 1 gram of wet soil. Convert this to the number of organisms in the community in 1 gram of '''dry weight''' soil. <BR><BR> | The area of each field of view at 1000X using the Fluorescent scope is 10487 μmeters<sup>2</sup>. The area is determined for the microscope used, in our case, a NIKON 80i fluorescent microscope. The diameter of the filterable section of the borosilicate apparatus is 17 mm (8500 μmeter radius). Therefore, the area is 2.28 X 10<sup>8</sup>μmeter<sup>2</sup>. Multiply the number of microorganisms counted on the photomicrograph by a factor of 2.17X10<sup>4</sup> (2.28 X 10<sup>8</sup>μm<sup>2</sup> divided by 1.0487 x 10<sup>4</sup>μmeters<sup>2</sup>) to determine the number of organisms found in 1mL of filtrate of extract. Then correct for the 1:100 dilution factor of filtrate which is the number of organisms in 1 gram of wet soil. Convert this to the number of organisms in the community in 1 gram of '''dry weight''' soil. <BR><BR> | ||
After each person has collected their data, post the numbers to the class spread sheet and, of course enter all calculations in your lab notebook. Record these numbers in scientific notation (and as numbers with no decimals and with an amazing number of zeros). <BR> | |||
Now that we have some sense of the abundance of microbes in a soil community we can move on to investigating the richness (diversity) and the co-operative and competitive behaviors that maintain it. | Now that we have some sense of the abundance of microbes in a soil community we can move on to investigating the richness (diversity) and the co-operative and competitive behaviors that maintain it. | ||
Revision as of 21:28, 22 August 2013
LAB 2: Enumerating Microbial Members & Isolating Bacterial Members of a Soil Community
Today you will complete your first investigative goal in our semester long project: assessing abundance of a soil microbial community by enumerating its microbes by two methods, one culture dependent and one culture independent. Today you will also continue acquiring and practicing skills used by working microbiologists. The results of the fluorescent DNA stain are available and your plate counts are ready to assess. In addition, you will continue to isolate a few bacteria of interest from your soil community in order to show evidence for richness (diversity) and potential for co-operative and competitive behaviors among community members. Next week we will begin testing the whole soil microbial community : a culture-dependent assessment of carbon source utilization diversity.
Abundance Test 1: Finishing the Standard Plate Count
Last week you started a standard plate count of the culturable microbes in your soil sample on dilute nutrient agar. Today you will complete that plate count to get one kind of enumeration of the microorganisms in your soil community.
Calculating the number of colony forming units (CFU) per gram of soil
Examine the plates at each dilution and find one dilution with between 30 and 300 colonies. You will not assess plates with well over 300 colonies or under 30; they should be designated as "invalid" in your lab notebook. Count all the surface and subsurface colonies on the replicate valid plates (those with 30-300 colonies). The colonies can be more easily counted by using a Quebec Colony Counter which allows proper illumination, a grid overlay, and slight magnification of the plate surface. (There are two colony counters in the lab.) divide the total number of colonies counted by the amount of inoculum plated times the dilution factor of that plate to obtain the number of bacteria per gram of soil.
number CFU/(dilution plated*dilution factor) = number of CFU/gram
For example, if you counted 150 colonies on the 10-6 plate the calculation is:
150/(0.1ml inoculum*1X10⁻⁶dilution)= 150X107 which in scientific notation is written as 1.5X10⁹ CFU/gram
Record the number of CFU/ gram of wet soil in your lab notebook and enter your data on the course spreadsheet on the instructor's computer at the front of the lab. Calculate the average and standard deviation for all the plates from your sample site. Note that this number is the average colony forming units/gram WET soil for your sample site.
Soil bacteria are usually not recorded as number of colony forming units (CFU) in 1 gram of WET soil but instead as per gram of DRY weight. Therefore, you will need to figure out your counts as DRY weight. Please weigh each of the three 1 gram samples that you left last week for oven drying. Average the new dry weights. The weights should be considerably less than 1 gram.
Determine the % change in soil weight by subtracting the average dry weight from 1 g wet weight divided by the wet weight, then times 100.
[(wet weight - dry weight)/wet weight] * 100 = % change
Use this % change to convert the CFU per gram wet soil to CFU per gram dry soil. For example: If your dry weight soil averages 0.75 grams, then (1g-0.75g)/1g * (100) = 25% change. The number of microbes should be 25% higher than the number calculated above/gram of wet weight. Calculate 25% (or whatever your conversion factor is) of your CFUs and add that number to the CFUs/ gram of wet weight soil.
Record the number of CFU/ gram DRY weight soil in your lab notebook and add this information to the chalk board. If you are unsure of the accuracy of your calculations of CFUs per gram of wet soil weight and per gram of dry weight, check with your instructor. You will need accurate counts for some of our future testing.
Things to Consider:
Why did we perform so many dilutions when we set up our plate count in Lab 1?
Why should you have only one dilution with 30-300 colonies?
Why did we make up to 4 replicates per site?
Do you expect the results of this enumeration of soil microbes in your community to be the same, lower, or higher than the results of our other enumeration test (the DAPI DNA stain)? Why?
Don't discard any plates yet.
Abundance Test 2: Enumeration of Community Soil Microorganisms by Direct Count of Microbial DNA Stained & Viewed by Fluorescence Microscopy
You can directly count a random sample of microbes from the soil extract that you prepared last week and then extrapolate the number per gram of soil. To make the microbes easier to count, you stained the nucleic acids of your soil community microbes (not just the bacteria) with a fluorescent 4'-6-Diamidino-2-phenylindole (DAPI) DNA stain. All the microbes in a 1ml aliquot of the 1% soil extract that you prepared last week were transferred in a Poisson distribution to a small piece of filter paper. Your instructor photographed the discreet bright "spots" of fluorescent DNA in several different areas of the filter paper distribution using fluorescence microscropy. You will each count the discreet "spots" (individual microorganisms = one fluorescent genome/cell) from and perform the calculations described below to assess the total microbial concentration in this culture-independent enumeration of your soil community's microorganisms.
COUNTING & CALCULATIONS:
The area of each field of view at 1000X using the Fluorescent scope is 10487 μmeters2. The area is determined for the microscope used, in our case, a NIKON 80i fluorescent microscope. The diameter of the filterable section of the borosilicate apparatus is 17 mm (8500 μmeter radius). Therefore, the area is 2.28 X 10⁸μmeter2. Multiply the number of microorganisms counted on the photomicrograph by a factor of 2.17X10⁴ (2.28 X 108μm2 divided by 1.0487 x 10⁴μmeters2) to determine the number of organisms found in 1mL of filtrate of extract. Then correct for the 1:100 dilution factor of filtrate which is the number of organisms in 1 gram of wet soil. Convert this to the number of organisms in the community in 1 gram of dry weight soil.
After each person has collected their data, post the numbers to the class spread sheet and, of course enter all calculations in your lab notebook. Record these numbers in scientific notation (and as numbers with no decimals and with an amazing number of zeros).
Now that we have some sense of the abundance of microbes in a soil community we can move on to investigating the richness (diversity) and the co-operative and competitive behaviors that maintain it.
Adapted from Schallenberg, M., Jacob, F. and Joseph B. R. (1989) Solutions to Problems in Enumerating Sediment Bacteria by direct counts. Applied & Environmental Microbiology. p. 1214-1219.
Compare and Contrast
Compare this number to the calculation of CFUs/gram of wet soil (a culture-dependent assessment) that you will also obtain today. Compare the two counts that, in theory, should be the same since we are using two methods to figure out the same thing: how many microbes per gram comprise your soil community. The answer will provide evidence for one of our investigative goals: abundance or microorganisms in your soil community. What does it mean if your two experimental methods don't give the same answer?
RICHNESS OF A MICROBIAL SOIL COMMUNITY:
Structural Diversity in Cultured Bacteria from a Soil Community
Using General Purpose Media for Isolation of Soil Bacteria in a Mixed Population
Please watch the YouTube video on streaking for isolation and pay attention to your instructor's demonstration: http://www.youtube.com/watch?v=eyoW18Fzb3o
Directions for Streaking for Isolation are found in the Protocols section of this wiki.
We hope that you have thousands of bacterial colonies on the NA+ starch and dilute NA plates that you set up last week for your colony enumeration. You and your partners should share these plates to find interesting bacteria that you would like to study. Your goal is that for each student to end up with two pure cultures of bacteria that are different from your classmates. Look for colonies that are different in color, texture, size, or other characteristics. We want to avoid isolating fungi so avoid black, or fuzzy growth that looks like mold. Check with your instructor after you and your partners have each selected a few colonies to attempt to isolate. You can circle the colony and put your initials on the plastic bottom on the plate to indicate the colonies you've chosen. When you are ready to sub-culture them, get new NA plates from the supply area (one per colony) and follow the directions for streaking for isolation described below.
Streaking for Isolation from Solid Medium to Solid Medium:
You can find the steps for Streaking for Isolation in the Protocols section of this wiki.
- Flame your loop, let it cool a few seconds. Remove or tilt the lid of the donor agar plate with your non-dominant hand but keep the lid in your hand (don't put the lid down on the bench!). With your dominant hand holding the flammed and cooled loop, touch the loop to an interesting colony of bacteria that you want to study and pick up a TINY amount of the colony. Avoid touching other bacterial colonies. Close the lid of the donor plate.
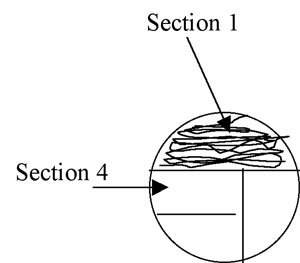
- TIlt the lid of a new sterile plate of solid medium (in this case it will be Nutrient Agar) with your non-dominant hand so that it is partially open. Do not put the lid down on the bench; keep it in your hand! Touch the loop with the bacteria to the surface of the agar in an area near the periphery of the plate and gently glide the loop over the innoculum to spread it over a small area of the plate called Section 1 as shown in the illustration below. Do not gouge the agar! Replace the lid.
- Flame your loop and let it cool for a few seconds.
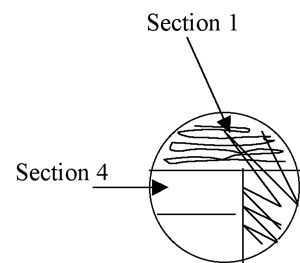
- Tilt the lid of the plate so it is partially open and drag your loop once or twice through the area you have just innoculated (section 1) and spread the innoculum you picked up across the surface of a new section of the plate. This section is called Section 2.
- Flame and cool your loop.
- Repeat to streak sections 3 and 4 by dragging your loop through the last section innoculated once or twice and then to a new area of the plate. Replace the lid.
- Label the recipient plate on the bottom (NOT the lid!), invert it, and incubate the plate at RT.
- Check your plate for colonies daily and record your descriptions of the texture and shape of the colonies that appear.

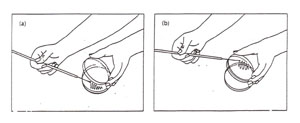
Figure A-2: Two options for aseptic transfer into a plate. (a) Streaking a plate while holding the lid ajar. Note that the lid shields the agar from airborne contamination: (b) streaking a plate while holding the bottom of the plate. Note that the agar surface faces downward, thereby minimizing contamination from the air.

Figure A-3: Pattern for isolation streaking section 1 of a plate.

Figure A-4: Illustration of isolation streak technique section 1 to section 2.

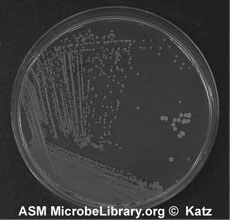
Figure A-5: An example of growth 24-72 hours after isolation streaking a plate to obtain isolated colonies.
Over the next few weeks you will continue to sub-culture onto new plates, using your best isolation streak technique. Your goal is to continue to streak out ONE CFU until you are sure that all the bacterial growth in a colony comes from a single mother cell (pure culture). In subsequent labs you will make a bacterial smear and do a Gram stain of these genetically identical bacteria and you will perform other tests from freshly pure cultures to explore the physical and metabolic characteristics of this isolate.
Some bacteria often form tough leathery colonies, so transfer of these bacteria to new media to start a sub-culture is sometimes difficult. The powdery area may be spores, which would be interesting to visualize later. To isolate spore formers try to "break off" a piece of the colony with your sterile loop or with a sterile toothpick and transfer that whole piece of a colony onto zone one of the new plate. Then use your loop for streaking out the other zones. The tiny spores on the surface of the colony are likely to transfer to the next plate or tube when you work with it. (That's a good thing this time.)
This process of transferring a single well isolated colony to new solid medium will continue your attempt until you succeed in isolating two different bacteria to pure culture. Our goal as a course is to find a diverse group of interesting soil bacteria .
CLEAN UP
1. All culture plates that you are finished with should be discarded in the big orange autoclave bag near the sink next to the instructor table. Ask your instructor whether or not to save stock cultures and plates with organisms that are provided.
2. Culture plates, stocks, etc. that you are not finished with should be labeled on a piece of your your team color tape. Place the labeled cultures in your lab section's designated lab area at room temperature (RT), the walk-in 30°C room, or the walk in cold room. Place any tubes in a labeled rack. If you have a stack of plates, wrap a piece of your team color tape around the whole stack and label it with your initials and the date.
3. Remove tape from all liquid cultures in glass tubes. Then place the glass tubes with caps in racks by the sink near the instructor's table. Do not discard the contents of the tubes.
4. Glass slides or disposable glass tubes can be discarded in the glass disposal box.
5. Make sure all contaminated, plastic, disposable, serologic pipets and used contaminated micropipet tips are in the small orange autoclave bag sitting in the plastic container on your bench.
6. If you used the microscope, clean the lenses of the microscope with lens paper, being very careful NOT to get oil residue on any of the objectives other than the oil immersion 100x objective. Move the lowest power objective into the locked viewing position, turn off the light source, wind the power cord, and cover the microscope with its dust cover before replacing the microscope in the cabinet.
7. If you used it, rinse your staining tray and leave it upside down on paper towels next to your sink.
8. Turn off the gas and remove the tube from the nozzle. Place your bunsen burner and tube in your large drawer.
9. Place all your equipment (loop, striker, sharpie, etc) including your microfuge rack, your micropipets and your micropipet tips in your small or large drawer.
10. Move your notebook and lab manual so that you can disinfect your bench thoroughly.
11. Take off your lab coat and store it in the blue cabinet with your microscope.
12. Wash your hands.
13. See you next time!
Assignment
Graded Assignment:
The directions for this assignment found at: Lab 2 Assignment: Assignment 2.
Do before next lab:
1. Someone from your team must go to your sample site and collect a new soil sample as you did in Lab 1. On the day of Lab 3, BEFORE lab begins, stop by the lab to pick up a plastic bag containing materials for collecting a new soil sample from your sampling site. This time your group will only need enough soil to fill half of a sterile, 15ml, orange capped, conical tube. Make sure you get the sample for THE SAME sampling site as your original sample. Again avoid the top few millimeters of surface soil and wear gloves to avoid contaminating the sample with bacteria from your skin. You probably won't need to use the corer; a disinfected metal spatula or even a spoon should work fine. Bring your new soil sample to lab with you and please be on time.
2. Goal for Cultured Bacteria Isolation: Obtain pure cultures of a variety of interesting bacteria in a soil community
One goal in this project is for your group to end up with pure cultures of 2 unique soil bacteria per student. Work with your partners over the next several weeks so that you each choose different looking bacterial colonies to isolate to pure culture. Make sure that some come from all the different media. Your goal is for each team member's subset to be unique and for the whole group sample to be as diverse as possible.
Note that isolation of desired bacteria from mixed culture is challenging. Your best technical and organizational skills are required. You will be expected to come in outside of lab time, on your own, to start, continue or complete the process of isolating to pure culture. We will make every attempt to make the media and reagents that you require available when you need them, but that availability requires advance planning on your part as well as on ours. Communicating your needs or desires well in advance of time of use, will reduce frustration and speed up the process. Remember that because this is an investigative, project based lab course, your instructors do not know the identity of the bacteria you are culturing from your soil habitat. The success of this project is in your hands.
Links to Labs
Lab 1
Lab 2
Lab 3
Lab 4
Lab 5
Lab 6
Lab 7
Lab 8
Lab 9
Lab 10
