Protein Quantification Using ImageJ: Difference between revisions
From OpenWetWare
Jump to navigationJump to search
| Line 44: | Line 44: | ||
10. Once all lanes are defined, go to '''Analyze→Gels→Plot lanes''' (or use "Ctrl+3") to generate histograms of each lane | 10. Once all lanes are defined, go to '''Analyze→Gels→Plot lanes''' (or use "Ctrl+3") to generate histograms of each lane | ||
: [[Image:imagejhistogram.jpg|200px]] | : [[Image:imagejhistogram.jpg|200px]] | ||
: - I don't know why this one seems to be upside down, but the peaks in each grid correspond to the intensity of the bands in the land. | : - I don't know why this one seems to be upside down, but the peaks in each grid correspond to the intensity of the bands in the land. | ||
: Standards lanes should only show one peak, while lane with protein you want to quantify will probably show multiple bands, as in the image below | : Standards lanes should only show one peak, while lane with protein you want to quantify will probably show multiple bands, as in the image below | ||
: [[Image:imagejhistomultibands.jpg|200px]] | : [[Image:imagejhistomultibands.jpg|200px]] | ||
Revision as of 22:16, 29 May 2013
Determining the concentration of protein in SDS-PAGE gel bands using ImageJ
- To determine protein concentration you will need to have a standard curve to compare your samples to
- - For 5GB1, BSA works great as a protein standard, and a range of 0.025 μg/μL to 5.0 μg/μL works well as a range for the standard curve
- After running and destaining the gel, take a picture and save it as a .tif and as a .jpg (in case the tif file can’t be opened—an issue I am experiencing at the other lab).
- - Make sure you save your gel images as the same type of image (either .jpg or .tif) each time!
1. Download the ImageJ software: http://rsbweb.nih.gov/ij/download.html
2. Open ImageJ
3. Go to File→Open→(your image)
- Does your image look too dark or too light?
- - Image→Adjust→Brightness/contrast
- - I recommend saving the image with an updated name at this point so that you have it to go back to
- If image looks good as is...
4. Find the lane with the lowest concentration of BSA
5. Select the rectangle tool, and draw a box around the lane, making sure to include some of the empty gel between lanes and white space outside of the band

6. Go to Analyze→Gels→Select first lane
- - Can also use key command "Ctrl+1"
- - A tiny “1” will appear in the lane

7. Make sure your cursor shows as an arrow, grab the rectangle you just made, and drag it to the next lane
- - DO NOT DRAW A NEW RECTANGLE! You must drag the same rectangle you just made
- - The point here is to compare the band in each subsequent lane using the exact same size/white space/noise as the originally defined area in Lane 1
8. Go to Analyze→Gels→Select next lane
- - Can also use key command "Ctrl+2"
- - A tiny “2” will appear in the lane

9. Repeat steps 7-8 until all lanes have been selected and numbered
- - I think at this stage it's easiest to use key command "Ctrl+2" to continue numbering the subsequent lanes (less of a chance to mess up!)

- - I do not know how to correct the inevitable mistake boxes that you are going to happen and cannot be undone...I'm sorry! Deleting them will cause useless white space where the rectangle was previously. My best advice if you find yourself in that predicament is to close the file, reopen it and start again. You will get really good at marking the lanes, I promise. If you are some kind of wizard who knows how to fix these mistake boxes without having to start over again, you should let me know!

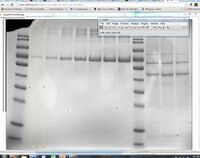
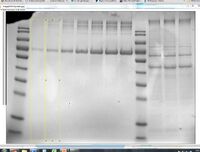
10. Once all lanes are defined, go to Analyze→Gels→Plot lanes (or use "Ctrl+3") to generate histograms of each lane

- - I don't know why this one seems to be upside down, but the peaks in each grid correspond to the intensity of the bands in the land.
- Standards lanes should only show one peak, while lane with protein you want to quantify will probably show multiple bands, as in the image below

