Protein Quantification Using ImageJ: Difference between revisions
From OpenWetWare
Jump to navigationJump to search
| Line 27: | Line 27: | ||
:- '''DO NOT DRAW A NEW RECTANGLE! You must drag the same rectangle you just made''' | :- '''DO NOT DRAW A NEW RECTANGLE! You must drag the same rectangle you just made''' | ||
:- You want to compare the band in each lane using the exact same size/white space/noise as the originally defined area | :- You want to compare the band in each lane using the exact same size/white space/noise as the originally defined area | ||
8. '''Go to Analyze→Gels→Select next lane''' | |||
:- A tiny “2” will appear in the lane | |||
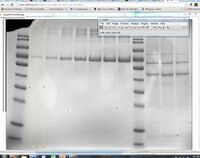
:- [[Image:imagejlane2]] | |||
Revision as of 21:40, 29 May 2013
Determining the concentration of protein in SDS-PAGE gel bands using ImageJ
- To determine protein concentration you will need to have a standard curve to compare your samples to
- - For 5GB1, BSA works great as a protein standard, and a range of 0.025 μg/μL to 5.0 μg/μL works well as a range for the standard curve
- After running and destaining the gel, take a picture and save it as a .tif and as a .jpg (in case the tiff file can’t be opened—an issue I am experiencing at the other lab).
- - Make sure you save your images as the same type of .tif each time!
1. Download the ImageJ software: http://rsbweb.nih.gov/ij/download.html
2. Open ImageJ
3. Go to File→Open→(your image)
- Does your image look too dark or too light?
- - Image→Adjust→Brightness/contrast
- If image looks good...
4. Find the lane with the lowest concentration of BSA
5. Select the rectangle tool, and draw a box around the lane, making sure to include some of the empty gel between lanes and white space outside of the band

6. Go to Analyze→Gels→Select first lane
- - A tiny “1” will appear in the lane

7. Make sure your cursor shows as an arrow, grab the rectangle you just made, and drag it to the next lane
- - DO NOT DRAW A NEW RECTANGLE! You must drag the same rectangle you just made
- - You want to compare the band in each lane using the exact same size/white space/noise as the originally defined area
8. Go to Analyze→Gels→Select next lane
- - A tiny “2” will appear in the lane
- - File:Imagejlane2
